Exchange Ranking
 Top Exchanges
 24h Volume Ranking
 Popularity Ranking
 Exchange BTC Balance
 Proof of Reserves
 Decentralized Exchanges
 Funding Rate
 Funding Heatmap
 Liquidation Data
 Max Pain
 Long/Short Ratio
 Whale L/S Ratio
 Binance/Okex/Huobi L/S
 Bitfinex Margin L/S
 ETF Tracker
 Solana ETF
 XRP ETF
 Hong Kong ETF
 Bitcoin Treasuries
 Crypto Reversal
 Ethereum Reserves
 HyperLiquid Wallet Analysis
 Hyperliquid Whale Watch
 Large Transactions
 On-chain Movement
 Bitcoin ROI
 Stablecoin Market Cap
 Options Analysis
 News
News Articles
 Economic Calendar
 Features
 Wallet
 Contract Calculator


 Security
 Collections
 Watchlist
 Following
 STX
STX Stacks Prices Today: Real-time Data and 24-Hour Changes
Stacks has been in a doldrums for a long time, and this August 2026 Stacks price forecast comes just as the chart finally shows signs of recovery.$ STX is currently trading at $0.1382, up 3.1% today, and is in a position where both a multi-year downtrend line and a short-term channel are being tested.
$STX is currently trading at US$0.1382, up 3.1% in the past 24 hours, with a trading range of US$0.1343 to US$0.1422. The market value is US$256.766 million, and the fully diluted valuation is almost the same at US$256.768 million. There is basically no gap because the circulation supply and total supply are the same. 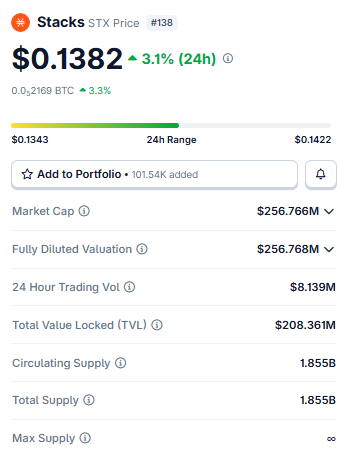 The total locked position value (TVL) on the Internet is US$208.361 million, which is considerable relative to the market value. The 24-hour trading volume was US$8.139 million. The circulation supply and total supply are both 1.855 billion STXs, and there is no upper limit on the maximum supply. Since there is no material gap between liquidity and total, unlocking pressure is not a factor in the August 2026 Stacks price forecast; it currently depends almost entirely on chart movements.
Technical Analysis: Key Support and Resistance
$STX is trading near an important technical area and the direction of the trend may be determined soon. Daily charts help identify levels that could become support during pullbacks or resistance during upturns.
Stacks Daily Chart Analysis: Downstream Channel
The daily chart shows that $STX has been sliding in a clear downward channel for several weeks. 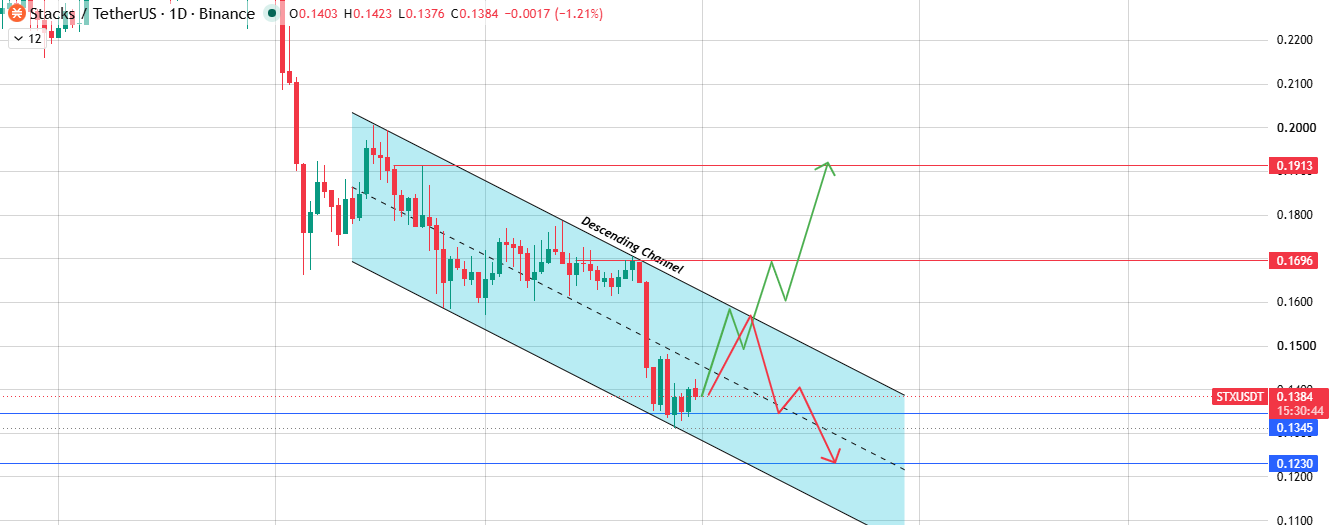 Prices are currently near the middle of the channel and are trying to recover back to the upper boundary of the channel. If prices break above the channel with considerable volume, resistance is first at $0.1696, and if buyers continue to pour in, the next resistance is at $0.1913. If the channel remains valid and the seller continues to control, then focus on the support level of $0.1345. If this level falls, the next support level is $0.1230.
Stacks Weekly Chart: Major Trend Line Test
Stretch the timeline, and the weekly chart tells a larger story.$ STX had previously surged by a staggering 2,710.86% in a historic market, when transaction volume exceeded 16.5 billion yuan. 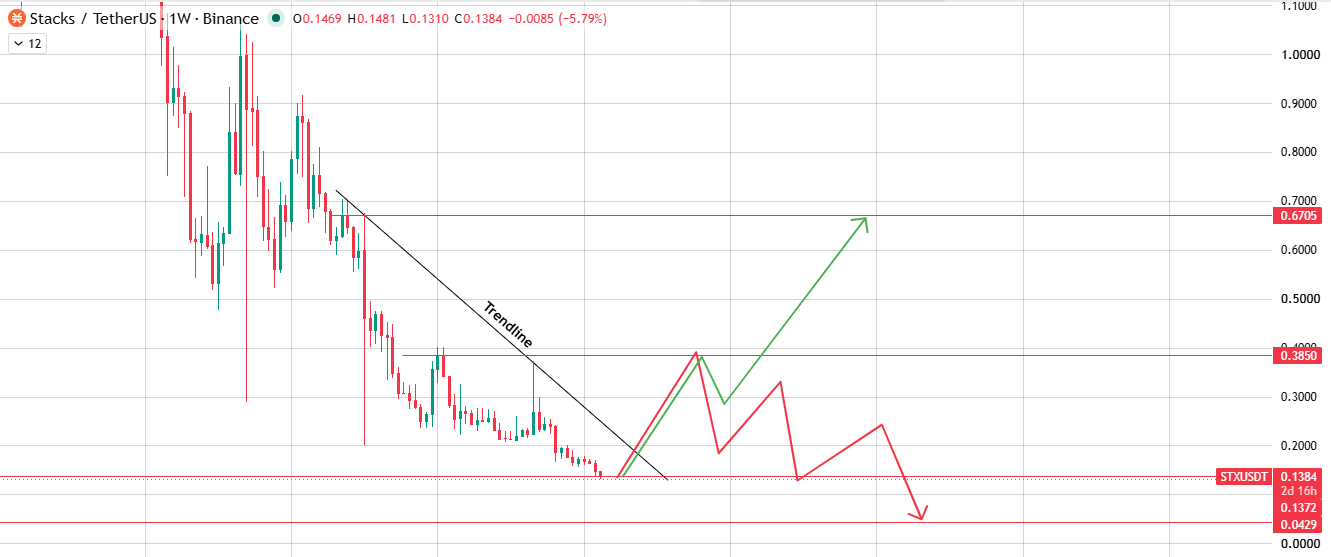 Prices have fallen for years since that high and are currently on a downtrend line that has been suppressed every rebound since then. If prices break through this trend line with real confidence,$0.3850 will become the first important target. If momentum really builds up, the next target will be $0.6705. If a breakthrough fails, or instead loses the current support area, the decline may extend to $0.1372, while if the long-term downtrend continues, the worst-case target is $0.0429.
August 2026 Stacks price forecast: bullish, neutral, and bearish scenarios
Here are what makes this August 2026 Stacks price forecast worth noting: $STX surged more than 2,700% in a historic market many years ago, and prices have been falling for most of that time, close to the starting point of that market. It is currently testing a long-term trend line that has long suppressed every rebound.
Bullish scenario: Targets of US$0.1696 to US$0.1913 (daily) and US$0.3850 to US$0.6705 (weekly); failure condition is blocked trend line: prices fail to hold the downtrend channel.
Neutral scenario: Target of US$0.1345 to US$0.1696 (range swings); failure condition is confirmation that the closing price exceeds either boundary.
Bear scenario: target of US$0.1230 (daily) and US$0.1372 to US$0.0429 (weekly); failure condition is a break below the daily channel and weekly trend line.
For a bullish scenario to actually occur,$STX needs to break through its daily channel and long-term weekly trend line with actual volume. If successful, the first stop on the daily chart is $0.1696, then $0.1913, while the larger targets on the weekly chart of $0.3850 and $0.6705 will open further when the rally is truly sustainable. The neutral scenario is much more bland;$STX is just trapped in this general area and oscillates back and forth without confirming any direction.
Catalyst that may drive Stacks in August 2026
Bitcoin Layer 2 network activity, continued developer work on the Stacks ecosystem, and trends in TVL this month are the main factors exclusive to $STX-worthy. In addition, whether $STX can truly break through the daily channel with actual trading volume and test the long-term weekly trend line may be the most important single factor in changing market sentiment. At the same time, we must also pay attention to the performance of the overall altcoin market.
Analysts 'predictions for Stacks
Is Stacks a good investment now? This largely depends on whether you believe a multi-year downtrend line is about to be breached, or whether $STX will be blocked again as before. The confirmation of the weekly closing of the trend line, especially the recovery of trading volume from the current moderate level, will be a really meaningful signal, as this trend line has been maintained for a long time. Blocking here suggests that the downtrend is still dominant. This is a chart-based analysis and not a commitment to subsequent trends.
Stacks Long-term Outlook: 2027 - 2030
If $STX breaks through the daily channel and breaks the weekly trend line this year, then the longer-term upside target looks towards $0.3850 between 2027 and 2028, and may even reach $0.6705, which seems like a reasonable extension target. The actual value of Stacks by 2030 will depend more on the actual adoption of the Bitcoin Layer 2 network and the growth of TVL than on any single chart level, but the current pattern at least provides a meaningful starting point.
Risk of potentially disabling the forecast (Stacks)
The most obvious risk is to be blocked again at the same weekly trend line, which has been maintained for a long time. This would open the way to $0.1372, and if support really fell, the deeper $0.0429 would become the worst-case target on the weekly chart. Given that the current trading volume is only US$8.139 million, it would not be surprising that a low-confirmation breakthrough and its rapid failure would not be surprising if the overall market sentiment did not cooperate.
Disclaimer : This Stacks price forecast is for informational and educational purposes only and should not be regarded as financial or investment advice. The cryptocurrency market is extremely volatile and prices can change rapidly. Before making any investment decisions, be sure to research and consult a qualified financial adviser.