
 Exchange Ranking
 Top Exchanges
 24h Volume Ranking
 Popularity Ranking
 Exchange BTC Balance
 Proof of Reserves
 Decentralized Exchanges
 Funding Rate
 Funding Heatmap
 Liquidation Data
 Max Pain
 Long/Short Ratio
 Whale L/S Ratio
 Binance/Okex/Huobi L/S
 Bitfinex Margin L/S
 ETF Tracker
 Solana ETF
 XRP ETF
 Hong Kong ETF
 Bitcoin Treasuries
 Crypto Reversal
 Ethereum Reserves
 HyperLiquid Wallet Analysis
 Hyperliquid Whale Watch
 Large Transactions
 On-chain Movement
 Bitcoin ROI
 Stablecoin Market Cap
 Options Analysis
 News
News Articles
 Economic Calendar
 Features
 Wallet
 Contract Calculator


 Security
 Collections
 Watchlist
 Following
 ENS
ENS ENS August 2026 Price Forecast: Market attention is increasing and chart signals are emerging
ENS August 2026 price forecast discussions are gradually heating up as charts are beginning to show some unusual signals. The resistance encountered in the last two times from the daily downtrend line was significantly weaker than the previous times, and the most recent attempt even hit a breakthrough before the momentum exhausted. Signs of this pressure fading often appear before a real shift in momentum, although a trend reversal is far from confirmed. This article will analyze the current key support and resistance levels on daily and weekly charts, the basic composition of existing holders, and what key prices the long and short sides need to hold or break through before entering August to gain real leadership.
ENS Price Today: Real-time Data and 24-Hour Changes
$ENS Current price is approximately US$4.24, down 0.81% in the past 24 hours.
has a market value of approximately US$174.35 million, well below the unlocked market value and fully diluted valuation of approximately US$424.9 million, as most supply remains locked. Trading volume in the past 24 hours was approximately US$11.53 million, up 3.9%, with the volume-to-energy ratio (volume/market value) at 6.57%, and the liquidity ratio (liquidity/market value) at 0.75%. Among the fixed total of 100 million ENS, the current circulating supply is 41.02 million, distributed among approximately 67,790 holder addresses.
Holder concentration and on-chain snapshots (ENS)
The ownership of ENS is highly concentrated at the head address. 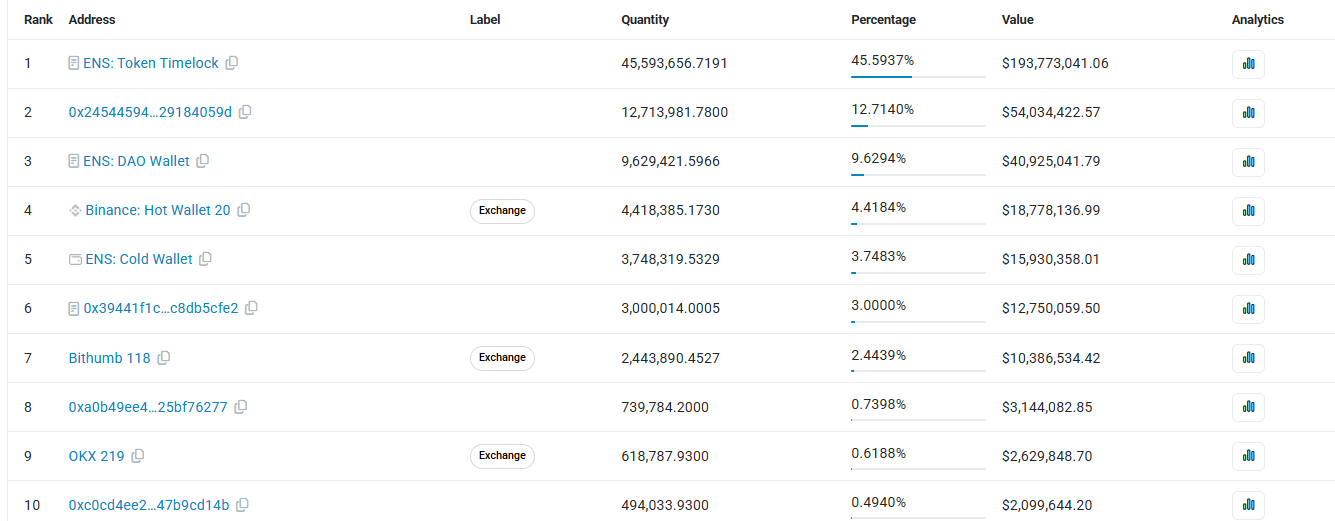 The largest single holder is the ENS token time-locked contract, which controls 45.59% of the supply; followed by an unmarked wallet, which holds 12.71%; and the ENS DAO wallet holds 9.63%. The top five addresses together account for more than 76% of the total market value.
 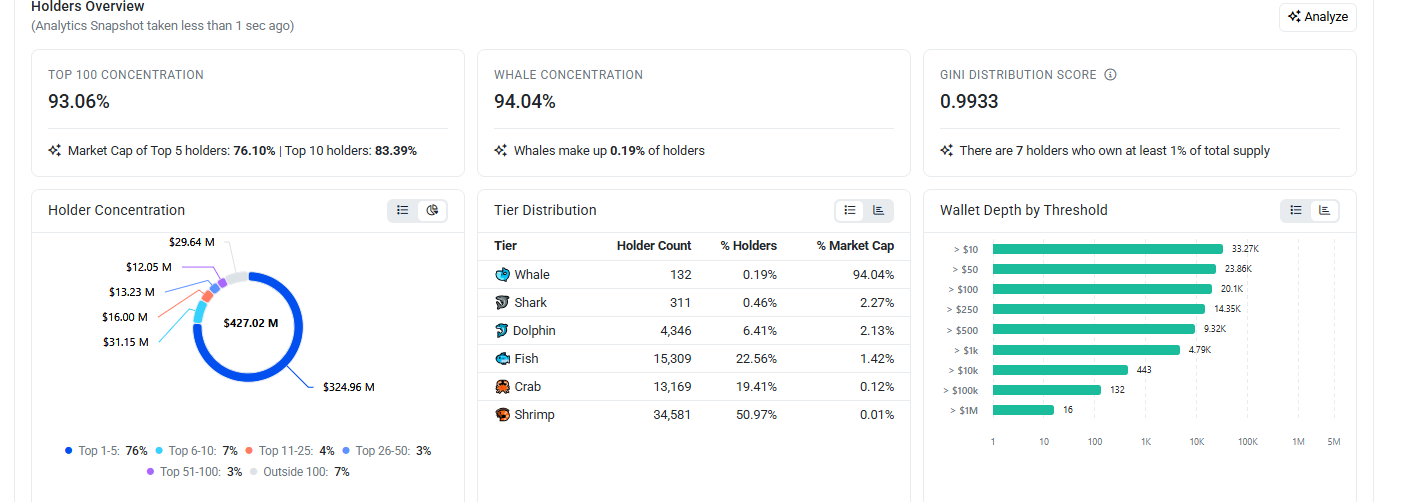 Exchange wallets also appear at the bottom of the list, with Binan Hot Wallet 20 holding 4.42%, Bithumb holding 2.44%, and OKX holding 0.62%. Broader concentration indicators reflect a similar situation: the top 100 addresses hold 93.06% of supply, while giant whale addresses account for only 0.19% of all holders, yet control 94.04% of market value, and only seven wallets each hold at least 1% of total supply. It's worth noting that a large part of this concentration lies in token time-lock contracts and DAO wallets, which function more like protocol-controlled reserves than proactive seller supply, so this is different from a few individuals holding huge influence.
Quick View
Current market price: US$4.24 (Intraday decline of 0.81%)
Daily trigger conditions: Close above US$4.74, target looks at US$5.82, then US$8.16
Daily failure conditions: Close below US$3.95 will expose the psychological threshold of US$3
Weekly trigger conditions: Closing price above US$8.119, target looks at US$11.483, then US$16.074
Weekly failure condition: Closing price below US$3 will expose the psychological barrier of US$2
Daily RSI: 44.40| Weekly RSI: 34.52
Data as of July 31, 2026 IST time
$ENS August 2026 technical forecast
ENS has been subject to the downtrend line on the daily chart for several weeks, and every time it touches this line, it will trigger a new sell-off. 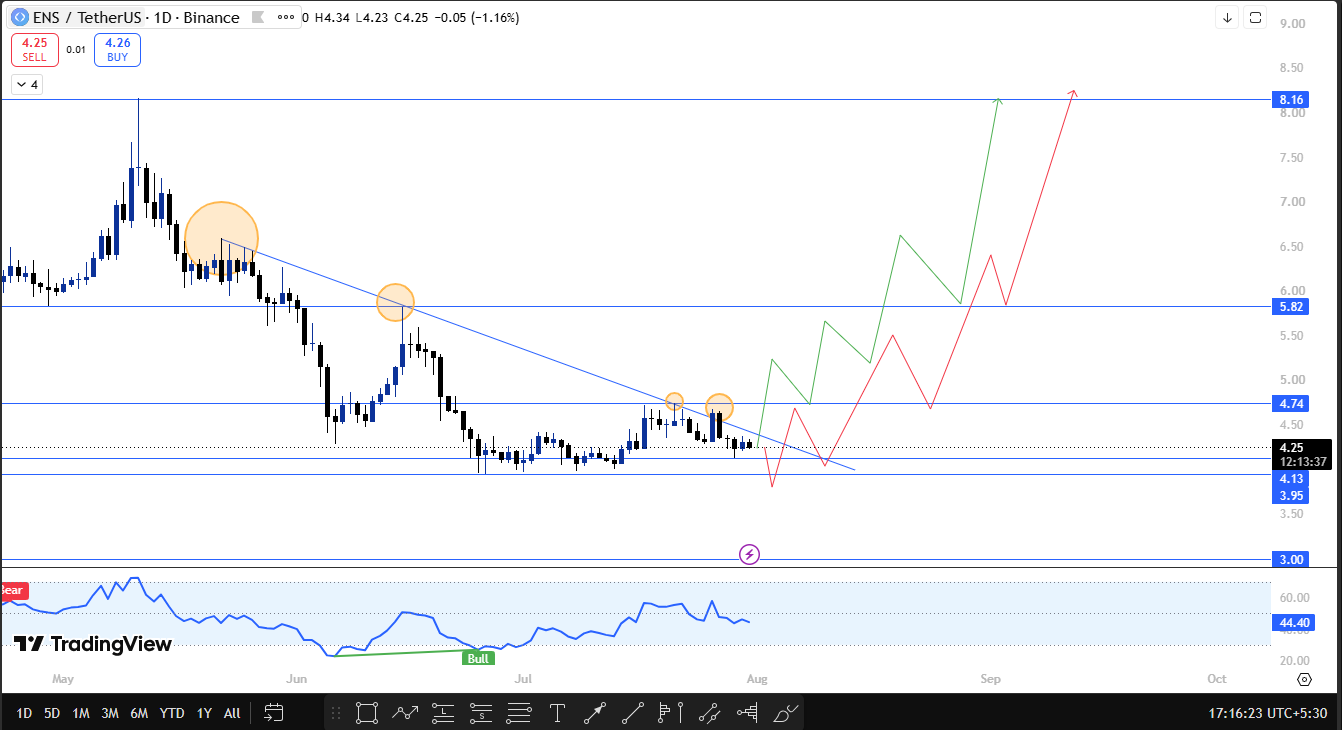 However, when the line was touched for the third and fourth times, the pattern began to change and selling pressure weakened significantly. The fourth time I touched and even tried a breakthrough, but in the end I failed to stand firm. If the ENS can achieve a daily close above $4.74, the next resistance area will open to $5.82, followed by $8.16 further away. Conversely, if the closing price is below $3.95, the psychological level of $3 will become the focus again and become the next support level.
Zoom in to the weekly chart, ENS is currently operating in a downward wedge pattern, with prices showing signs of gaining support at support and buying interest re-entering. 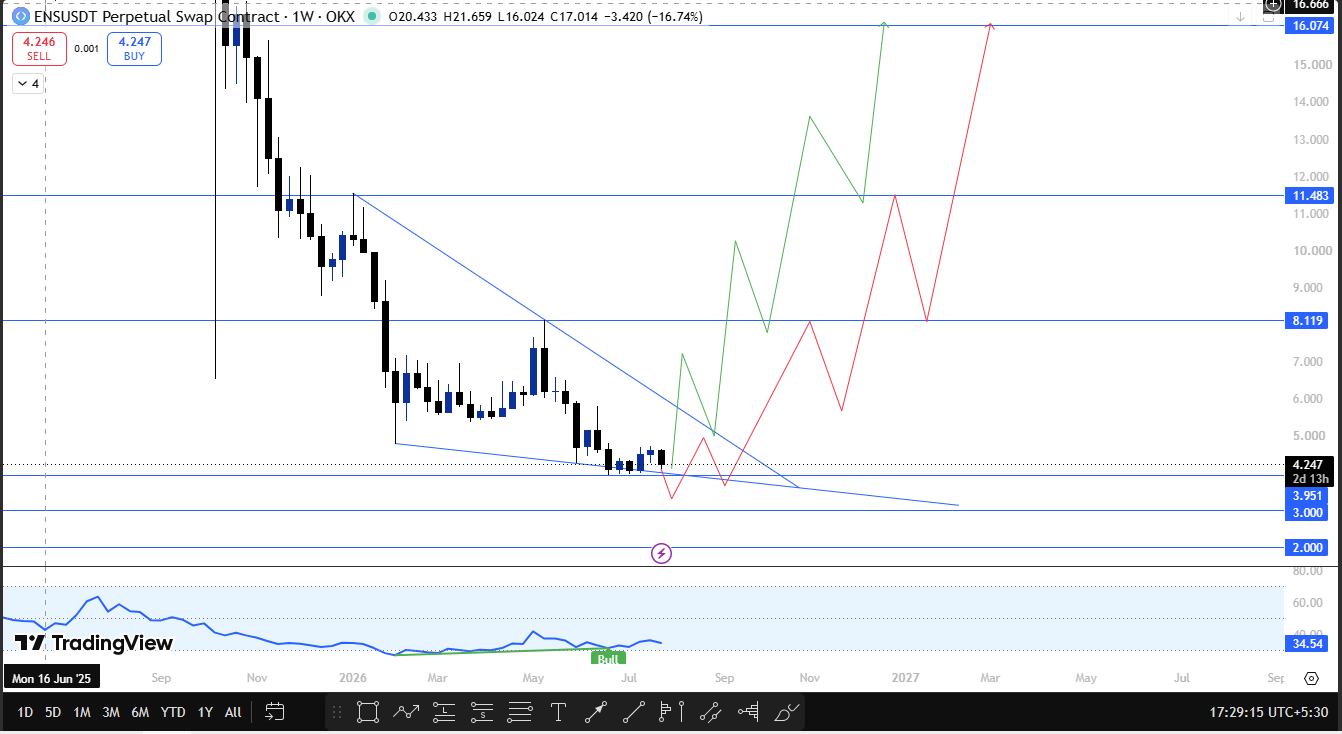 If it is confirmed that the weekly closing price is above $8.119, the upper resistance ladder will be opened, looking towards $11.483 and $16.074 in turn. On the downside, if the weekly closing price is below US$3, the market's attention will turn to the psychological level of US$2 as the next support level to pay attention to.
Technical analysis: Key Support and Resistance Levels (ENS)
Time Period-Resistance Level-Support Level-Trigger Conditions
Daily Line-$4.74,$5.82,$8.16-$3.95, US$3.00-Closing price above/below US$4.74/US$3.95
Weekly-US$8.119, US$11.483, US$16.074-US$3.00, US$2.00-Closing price above/below US$8.119/US$3.00
$ENS August 2026 Price Forecast: Bullish, Benchmark and Bear Scenarios
Benchmark Scenario: The ENS is expected to continue to operate within the weekly declining wedge in August, while daily charts are digesting the recent weak resistance response, but there are currently no confirmed breakthrough signals in either time frame.
Bullish scenario: The daily close price is required to be above $4.74, which will open up upside to $5.82 and then $8.16; if the weekly close price can also exceed $8.119 at the same time, this scenario will be more substantial and may push prices towards $11.483 and $16.074.
Bear scenario: The trigger condition is that the daily closing price is lower than US$3.95; if the weekly closing price is also lower than US$3, the situation will be more severe, and the psychological barrier of US$2 will become the next target.
As with any scenario, the key is to confirm the closing price in the relevant time frame, rather than the price's brief hatching crossing that level.
Analyst Forecast ($ENS)
At present, there are obvious differences of opinion on ENS and basically meet expectations. One view points out that the weakening of selling pressure when the daily line hit the trend line in the last two times, coupled with the support and buying interest at the bottom of the downward wedge of the weekly line, are early signs of the exhaustion of downtrend momentum. The other view is that the weekly RSI is 34.52, which is still far below the neutral level, and that a failed breakthrough attempt on the daily chart does not mean a confirmed reversal of the trend. At present, neither faction has been confirmed, and they are both focusing on the same trigger: a decisive closing price out of the current range in a higher time frame.
ENS Long-term Outlook: From 2027 to 2030
If ENS finally breaks through the weekly resistance ladder of $11.483 and $16.074, it will mark a major shift in its long-term structure. The prerequisite for achieving this goal is to first hold on to the weekly support level of $3, as any such rally would be significantly delayed if it were to fall below that level. The highly concentrated supply in token time-locked contracts and DAO wallets is also worthy of attention over a longer time span, because how this locked supply is ultimately unlocked and deployed may profoundly affect the trend of ENS after August.
Risk that may invalidate this prediction ($ENS)
If the daily chart fails to close above $4.74, the bullish view will expire; if the weekly close below $3, it will further weaken bullish expectations and open a downward path to $2. Broader risks include shifts in Bitcoin's dominance, changes in overall market liquidity, and general cryptocurrency volatility, any of which could overwhelm the ENS's own chart structure. Given the high concentration of ownership in a small number of wallets, any large-scale movement of the head holder also deserves to be monitored independently of the technology.
How to securely purchase and store ENS
ENS can be purchased on major exchanges that provide a spot market for the token. After purchase, transferring it to your personal wallet rather than storing it on an exchange for a long time can reduce counterparty risk. For larger positions, hardware wallets are generally the safer option, and two-factor authentication should be enabled on any exchange account regardless of the size of the position.
Glossary
Downtrend line: A downwardly sloping line formed by connecting a series of successively decreasing highs that is used to track the current downtrend.
Falling wedge: A convergent chart pattern with successively decreasing highs and lows that narrows over time, usually ending in a breakthrough.
Swing highs/swing lows: A significant price peak or trough that forms before a temporary price reversal is often used as a structural reference point for support and resistance.
RSI (Relative Strength Index): A momentum indicator on a scale of 0-100. A reading below 50 indicates weak momentum, and above 50 indicates strong momentum.
Giant whale concentration: The share of total market value held by the largest wallet holder of the token.
Psychological barrier: An integer price often serves as a support or resistance area simply because traders pay close attention.
Failure level: The price point at which the forecast scenario is considered invalid.
Disclaimer : This document is for information purposes only and does not constitute any financial advice. The cryptocurrency market is highly volatile, and all price levels discussed are based on technical chart analysis and are not guarantees of future performance. Readers should conduct their own research before making any investment decisions.






















