Exchange Ranking
 Top Exchanges
 24h Volume Ranking
 Popularity Ranking
 Exchange BTC Balance
 Proof of Reserves
 Decentralized Exchanges
 Funding Rate
 Funding Heatmap
 Liquidation Data
 Max Pain
 Long/Short Ratio
 Whale L/S Ratio
 Binance/Okex/Huobi L/S
 Bitfinex Margin L/S
 ETF Tracker
 Solana ETF
 XRP ETF
 Hong Kong ETF
 Bitcoin Treasuries
 Crypto Reversal
 Ethereum Reserves
 HyperLiquid Wallet Analysis
 Hyperliquid Whale Watch
 Large Transactions
 On-chain Movement
 Bitcoin ROI
 Stablecoin Market Cap
 Options Analysis
 News
News Articles
 Economic Calendar
 Features
 Wallet
 Contract Calculator


 Security
 Collections
 Watchlist
 Following
 INJ
INJ Aggressive Price Forecast
Attention to its price forecast is gradually increasing as Aggressive retests the uptrend line of recent price movements. The currency recently broke through another downtrend line formed during its decline in late July and is now approaching a familiar uptrend line that has remained firm in multiple previous tests.
INJ Trends and momentum: Key points
INJ has been supported by a long-term uptrend line, with only a small rebound in the second test. The currency also broke through the downtrend line formed during the decline period from July 24 to 30. Prices are now close to this uptrend line again, while swinging support is also around $4.462. If the support level holds and a new breakthrough occurs, it is expected to open up space for $5.482 or even $6.109. If the closing price is below $4.462, the recent breakthrough of the downtrend line will expire and the market focus will shift to $4.020. The built-in momentum oscillator read 36.75 and remained weak after two bearish signals. During the 12-hour and 24-hour windows, long positions came under the most severe liquidation pressure to date.
INJ Current Price
Indicator: Price, Value: 4.718 USD
4-hour Opening/High/Low/Close: US$4.894/US$4.900/US$4.752/US$4.839
24-hour change: -2.84%(-0.1379 US $)
Market value: US$472.35 million
Futures volume (24 hours): US$82.58 million
Spot volume (24 hours): US$21.11 million
Open interest: US$74.45 million
Circulation supply: 99.97 million
Total supply: The 100 million
open interest contracts refer to the total value of derivative contracts that are still open on each exchange. It is a rough indicator of the current activity of Impressive leveraged Positions.
Chart source: INJ/USDT Perpetual Contract, 4-hour time frame, data captured at 2:32 pm Indian Standard Time on August 6, 2026 (09:02 UTC).
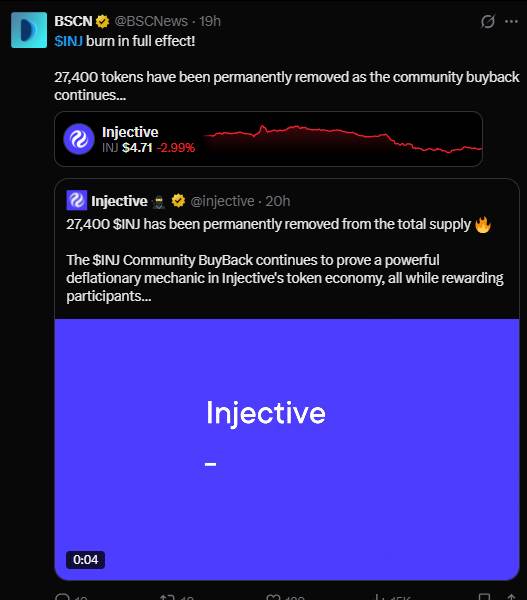 Aggressive confirmed that 27,400 INJ tokens have been permanently removed from total supply through its ongoing community buyback program, which the project describes as a deflationary mechanism in the token economy while also rewarding participants. The continued decline in circulating supply and total supply is a long-term fundamental factor that has nothing to do with short-term chart patterns, but is relevant background information for anyone who follows long-term INJ price forecasts.
Liquidation snapshot
Liquidation data from CoinGlass shows that long positions are significantly dominant over longer time windows. 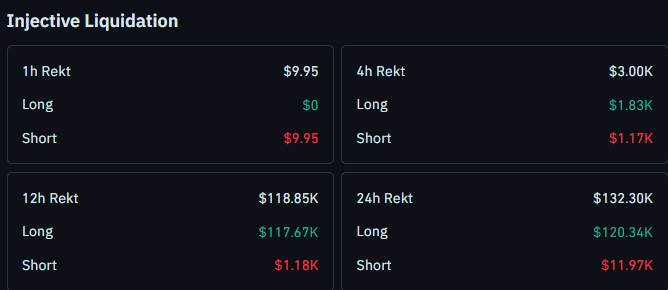 The total clearing amount within the one-hour window was only US$9.95, all of which came from short positions. The total amount of clearing within the 4-hour window was US$3000, of which US$1830 was long and US$1170 was short. This balance reversed sharply within 12 hours, with a total liquidation amount of US$118.85 million, of which long positions accounted for US$117.67 million; the same was true within 24 hours. Among the total liquidation amount of US$132,300, long positions accounted for US$120.34 million and short positions only US$11.97 million.
Is INJ's uptrend line about to be tested again?
Will the Impressive long-term upswing structure remain intact in the next test? The chart shows this, but the currency has not yet demonstrated that it can effectively push up from this trend line. 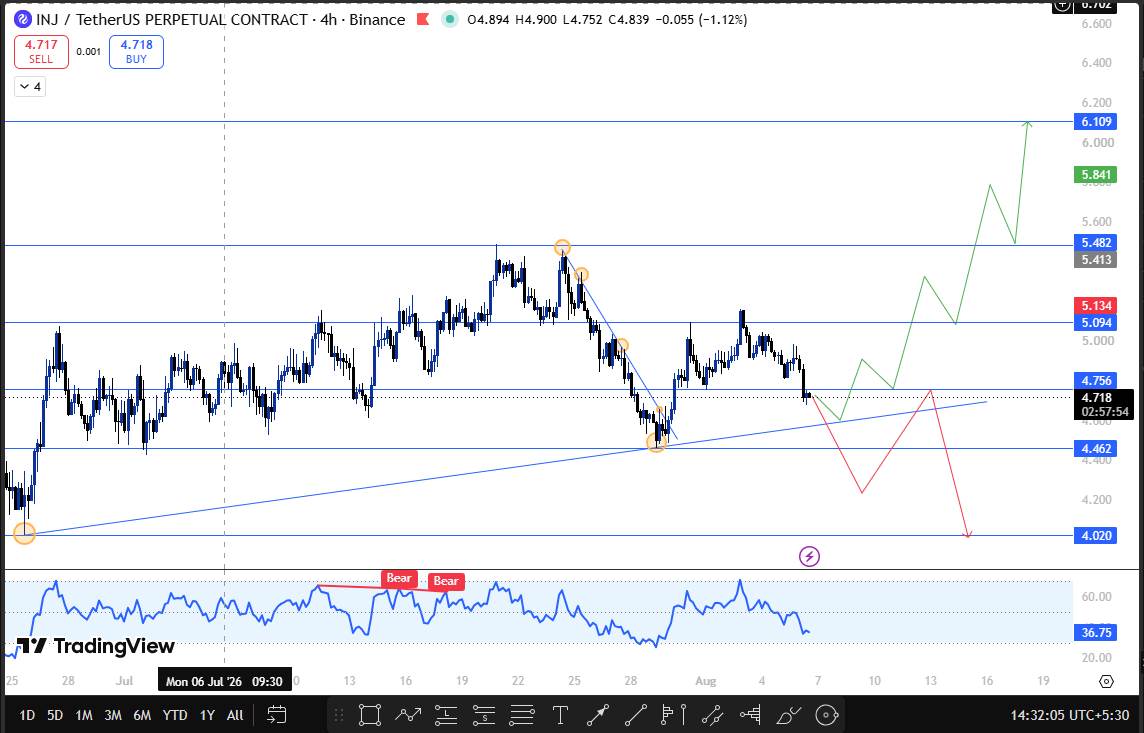 INJ has been supported by an uptrend line composed of a series of higher lows in recent months, and it has repeatedly touched this support while showing an overall upward trend. At the second test of the trend line, prices failed to rise significantly further, indicating that although the overall structure remained, upward momentum was weakening. At the same time, INJ also broke through an independent downtrend line formed during the sharp decline from July 24 to 30, and the price has now cleared this bearish structure. These two developments are converging. Prices are again approaching the uptrend line, with swing support in the same area around $4.462. If it can hold on to the area and achieve a new breakthrough, the key resistance area of primary concern is $5.482. If the rally continues, the expansion target is $6.109. The momentum oscillator RSI reading of 36.75 is still below the midline after two bearish signals, indicating that the Impressive price forecast is more cautious rather than confirmed bullish until prices actually break through resistance. Downside risks are also concentrated at $4.462. If the closing price is confirmed below this level, it means that the recent breakthrough in the downtrend line has not been held, weakening the bullish structure and shifting the focus down to $4.020 as the next swing support level.
Technical outlook snapshot
Indicators: Signals
Uptrend line: Long-term support is intact; a slight rebound in the second test.
Downtrend line: The downward structure from July 24 to 30 has been broken.
Momentum oscillator RSI: 36.75, below the neutral midline after two bearish signals.
Immediate bias: Be cautious around swing support at $4.462; need to confirm a breakthrough of $5.094.
Support and resistance levels that INJ needs to pay attention to
Type: Level, value: US$6.109, Notes: Long-range bullish target that continues to rise, swings high, distance from current price: +29.48%
Resistance 1: US$5.482, Notes: Front swing high zone, distance from current price: +16.20%
Current price: US$4.718, Notes: Trading below recent pivot point--
triggered break: US$4.462, Notes: Uptrend line test zone, swing low, distance from current price: -5.43%
Support 1: US$4.020, Notes: If US$4.462 falls, the next support level will swing low, from the current price: -14.79%
Risk-reward table
Scenario: Bullish, trigger condition: Hold the US$4.462 support and break through again, target: Move towards $5.094, and if it continues,$6.109 is in sight.
Scenario: Bear, trigger condition: close below $4.462, target: fall towards $4.020, failure to break through the downtrend line.
What will change this INJ price forecast?
As long as the price remains above $4.462, the trend is in the balance. Holding support and subsequent confirmation of a breakthrough will verify the bullish structure and bring US$5.482 back into focus; while a close below US$4.462 indicates that the recent breakthrough has failed and attention will turn to US$4.020.
How Bitcoin sentiment affects INJ
This pattern is built based on Injective's own chart, but Bitcoin usually still determines the extent to which such altcoins expand. A more stable Bitcoin chart would increase the odds that INJ would hold on to $4.462 and test $5.482, while a weaker Bitcoin would increase the risk that INJ would lose trend line support and fall towards $4.020.
When to review this INJ price forecast
This INJ price forecast will be reviewed when it is confirmed that the closing price is above US$5.094 or below US$4.462, or updated if no clear direction is confirmed within 24 hours of release.
Glossary
Uptrend Line: Connected a series of higher lows used to track directional support in an uptrend.
Downtrend line: Connects a series of lower highs to track resistance in a downtrend.
Swing highs and swing lows: Local peaks or troughs of price reversals on a chart, often used to mark support and resistance.
Open interest: The total value of derivative contracts that are still open and unsettled.
Liquidation: When a trader is short on margin, a leveraged position is forcibly closed.
Token destruction: Permanently removes tokens from circulation and total supply, often used as a deflation mechanism.
Bullish, Benchmark and Bear Scenarios
Bullish Scenarios: INJ holds on to swing support around $4.462, confirms that the uptrend line test was successful, and breaks through towards $5.482. If momentum improves, it will further extend to the $6.109 area, while benefiting from the continued deflationary background brought by INJ's community repurchase.
Benchmark scenario: INJ fluctuates between $4.462 and $4.756, waiting for a clear close in either direction, leaving the Impressive price forecast temporarily on the sidelines.
Bear scenario: INJ lost its uptrend line and closed below $4.462. The recent downtrend line failed to break through, and the price fell to a swing low to support $4.020.
Disclaimer
This INJ price forecast is based on technical chart analysis and market data at the time of writing. The cryptocurrency market is highly volatile and prices can change rapidly. The content of this article is for reference only and should not be regarded as financial advice. Be sure to do your own research and consult a qualified financial adviser before making any investment decisions.