Exchange Ranking
 Top Exchanges
 24h Volume Ranking
 Popularity Ranking
 Exchange BTC Balance
 Proof of Reserves
 Decentralized Exchanges
 Funding Rate
 Funding Heatmap
 Liquidation Data
 Max Pain
 Long/Short Ratio
 Whale L/S Ratio
 Binance/Okex/Huobi L/S
 Bitfinex Margin L/S
 ETF Tracker
 Solana ETF
 XRP ETF
 Hong Kong ETF
 Bitcoin Treasuries
 Crypto Reversal
 Ethereum Reserves
 HyperLiquid Wallet Analysis
 Hyperliquid Whale Watch
 Large Transactions
 On-chain Movement
 Bitcoin ROI
 Stablecoin Market Cap
 Options Analysis
 News
News Articles
 Economic Calendar
 Features
 Wallet
 Contract Calculator


 Security
 Collections
 Watchlist
 Following
 JTO
JTO JTO suddenly rose. What was the reason?
JTO is doing something that has not been able to do in the past few weeks. Prices are pushing to the ceiling, which has been suppressed every previous attempt at a rebound, and buyers now seem to finally have leverage. This JTO price forecast will analyze whether the current wave of gains can turn into a real breakthrough, or whether the downward channel will hold again.
Why did JTO suddenly rise?
JTO is trading at around US$0.5580 and has risen sharply by 10.16% in the past 24 hours. This one-day gain was enough to bring JTO back into traders 'discussions after a downturn, and this gain was accompanied by real follow-up momentum rather than a brief surge. 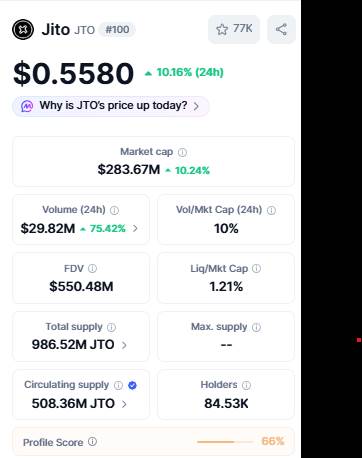 The bigger question that needs to be answered in this JTO price forecast is whether this momentum can push prices beyond the resistance level that has been going on for weeks.
Quick understanding of what Jito is
Jito runs in the Solana ecosystem and is known for its MEV infrastructure and liquidity pledge product JitoSOL, while being governed through JTO tokens and Jito DAO. 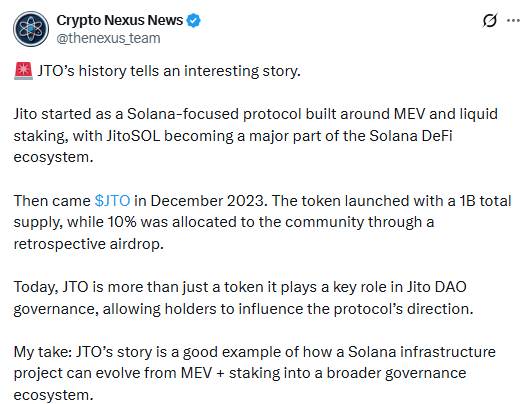 A recent Crypto Nexus News post reviewed this history, tracing Jito's growth from a Solana-focused MEV protocol to a broader component of Solana DeFi. This is background information rather than a new announcement, but it helps remind everyone why JTO gets attention whenever Solana-related activities are active.
What does JTO's downtrend channel tell traders?
On the TradingView daily chart, JTO remains in a downtrend channel that lasts for several weeks. 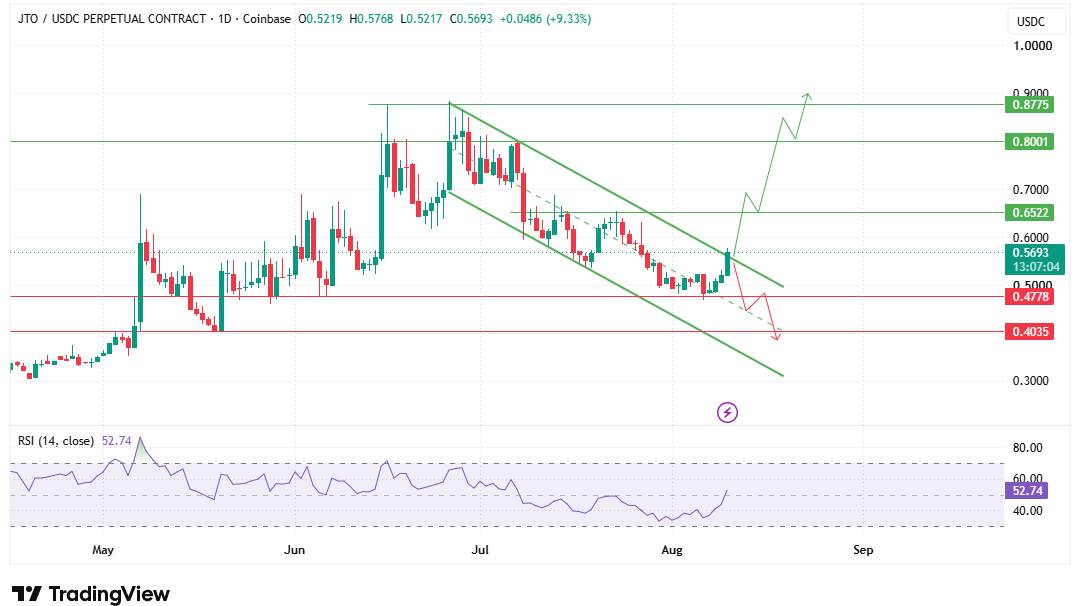 Prices have now rebounded to the upper boundary of the channel and are testing it directly, which is quite different from being in the middle of the range. A confirmed breakthrough means that the price closes above the channel and stays above that position, rather than just hitting the line intraday. JTO has not yet done this. It stood at the door, but had not yet crossed it.
The daily RSI has risen to 52.74, returning above the neutral 50 level for the first time in some time. This is indeed an improvement in momentum, but it is far from reaching an overbought or strongly bullish reading. RSI alone cannot confirm a trend reversal here. The testing of the channel still needs to be solved in some way.
Resistance and support after breakthrough
If JTO breaks through the downtrend channel and stands firm above it, US$0.6522 will become the first meaningful resistance level. If buyers can absorb selling pressure here, their attention will turn to $0.8001, and after continuing to strengthen and break through the area,$0.8775 further may come into view.
On the other hand, if a breakthrough attempt fails and the seller regains control,$0.4778 is the first major support level. Holding that level will keep broader attempts at rebound alive. A clear break below this level would weaken the structure and expose $0.4035.
What are futures traders actually doing?
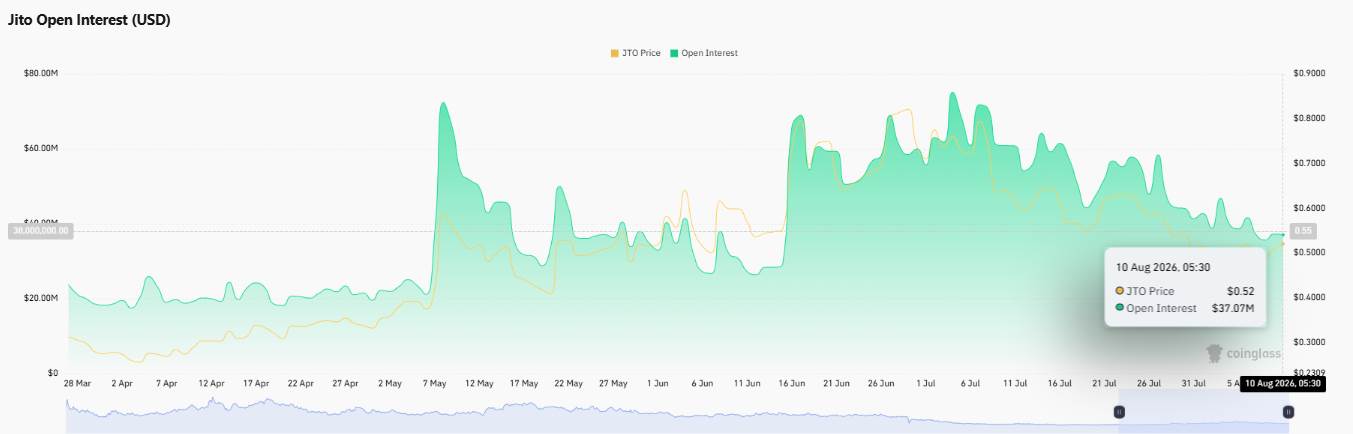
Derivatives trading activity is quite extensive on various exchanges. Binance shows futures trading volume of approximately US$19.41 million and OKX is US$12.39 million. The contributions of Bybit, WhiteBIT, MEXC and BingX are small but cannot be ignored. 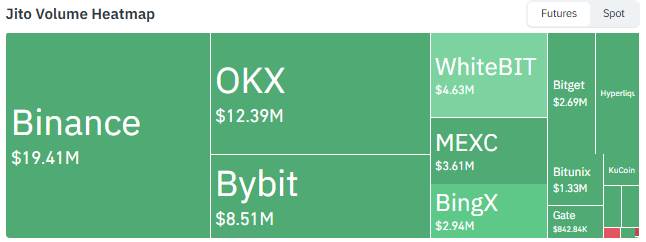 Open interest contracts are close to US$37.07 million, a level worthy of attention and serve as a background for support rather than an independent signal.
  The total liquidation amount in the past 24 hours was US$86530, of which short position liquidation accounted for US$70350, while long position liquidation accounted for only US$16180.
 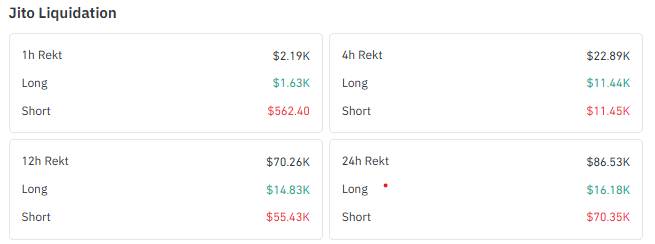 This imbalance is consistent with the upward trend, indicating that sellers were caught off guard when prices rose and were betting in the wrong direction.
The positions of each account are what makes this JTO technical analysis more interesting. 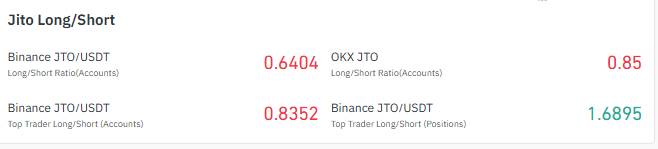 The long-short ratio of Binan's overall account is 0.6404, Binan's top trader account is 0.8352, and OKX account is 0.85, all of which are biased towards short positions. However, the position size of top Binance traders presents a different story, reaching 1.6895, much higher than 1. In other words, ordinary accounts remain cautious, but large traders 'long exposure by size is higher than the number of their accounts suggests. This is not unanimously bullish, but there is tension.
Bullish, neutral, and bearish scenarios
Bullish scenarios
JTO confirmed that it has broken through the daily downtrend channel and remained outside the structure. It will first include US$0.6522 in view. If it continues to strengthen, it will look towards US$0.8001. This was followed by $0.8775.
Neutral scenario
JTO stalled near the upper boundary of the channel, failed to achieve a clear breakthrough, consolidating near the level where the RSI was held at or near 50, and traders waited for direction confirmation.
The bearish scenario
JTO failed at the channel boundary, and sellers regained control of the situation, first putting pressure on US$0.4778. If it falls below this level, US$0.4035 will be exposed.
JTO's performance in various time cycles
The short-term momentum has shifted significantly. JTO has risen 0.63% in the past 4 hours, 11.94% in 24 hours, and 13.65% in the past week. 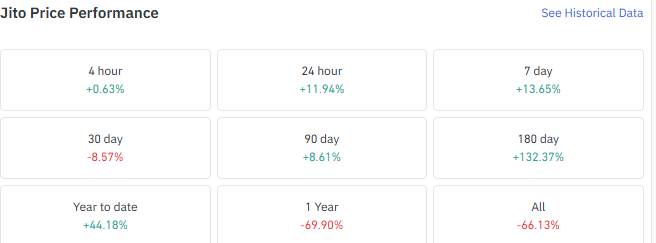 The performance during the 180-day window period was even more prominent, with an increase of 132.37%, while JTO rose 44.18% year-to-date. However, the situation is not generally strong. The 30-day return remained negative at-8.57%, while the one-year performance was severely damaged at-69.90%, with a total historical decline of 66.13%. This combination suggests that a real attempt at rebound is within a much weaker long-term trend and is not a completed reversal.
What should we focus on next
Analysts believe that JTO is at an important technical turning point rather than a confirmed reversal. The downtrend channel still defines a broader structure, but momentum is improving, the RSI is back above neutral, and bears have taken on a larger share of recent liquidations. Top Binance traders are biased towards long positions in position sizes, while broader account ratios remain cautious, adding a layer of subtlety rather than a clear bullish signal. If it continues to close above the channel, it will strengthen the basis for a rebound and make US$0.6522 an operational target. If this test is not held, US$0.4778 will come under pressure again. If selling pressure resumes, a deeper level of US$0.4035 will come into view.
Disclaimer : This article is for reference only and should not be regarded as financial or investment advice. The cryptocurrency market is highly volatile and prices can change significantly in either direction. Readers should conduct their own research and consult a licensed financial adviser before making any investment decisions. Past performance and technical forms do not guarantee future results.