Exchange Ranking
 Top Exchanges
 24h Volume Ranking
 Popularity Ranking
 Exchange BTC Balance
 Proof of Reserves
 Decentralized Exchanges
 Funding Rate
 Funding Heatmap
 Liquidation Data
 Max Pain
 Long/Short Ratio
 Whale L/S Ratio
 Binance/Okex/Huobi L/S
 Bitfinex Margin L/S
 ETF Tracker
 Solana ETF
 XRP ETF
 Hong Kong ETF
 Bitcoin Treasuries
 Crypto Reversal
 Ethereum Reserves
 HyperLiquid Wallet Analysis
 Hyperliquid Whale Watch
 Large Transactions
 On-chain Movement
 Bitcoin ROI
 Stablecoin Market Cap
 Options Analysis
 News
News Articles
 Economic Calendar
 Features
 Wallet
 Contract Calculator


 Security
 Collections
 Watchlist
 Following
 ADA
ADA Cardano has performed strongly recently, and expectations are high in the community as a new governance initiative is underway to improve DeFi mobility within the network. However, the ADA chart currently presents a different picture, and traders chasing recent gains need to remain vigilant. Bencardano's price forecast analysis will explore whether the momentum that has driven the ADA's rise over the past two weeks can continue, or whether the enthusiasm is encountering resistance as prices retreat from recent highs.
Market data check will be conducted at 12:09 IST time on August 12, 2026.
Today's Cardano price forecast: Market Overview
Indicators/Numbers
Price/ $0.1859
24-hour price/ -0.96%
Market cap/ $6.78B
Fully diluted valuation/ $8.35B
24-hour volume/ $251.7M
Volume/Market to Market Ratio (24 hours)/ 3.71%
Total Supply/ 44.99B ADA
Maximum Supply/45B $ADA
Circulation Supply/ 36.55B+ $ADA
Data Source: CoinMarketCap data as of 12:09 IST time on August 12, 2026. Data from other tracking sites may differ slightly.
Cardano Foundation Governance Vote: Announcement Contents
The Cardano Foundation's official account confirmed that they voted in favor of a governance action to withdraw 120 million ADA units for AlphaGrowth1's "Cardano PRIME" program. 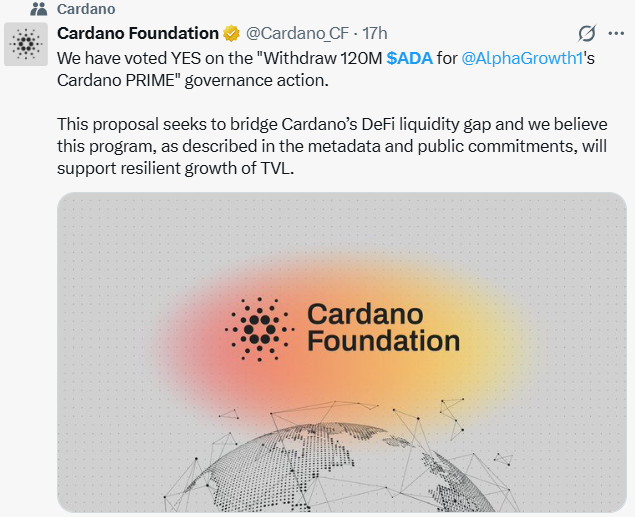 The proposal aims to close Cardano's DeFi liquidity gap, and the foundation said they expect the plan to support future growth in resilient total lock-in value (TVL, or the total value of assets deposited in the network's DeFi protocol). Since this news comes directly from Cardano's official account, it is considered a confirmed rather than an unverified statement, although the actual impact of the plan on TVL will depend on its implementation.
ADA prices rebound: Related reports
A report from the BSCN highlighted ADA price momentum, saying the token rose more than 13% to US$0.194 in 30 days, pushing the market value to approximately US$7.25 billion, and despite the weak 90-day and 365-day trends, it still marks a turning point in the short term. 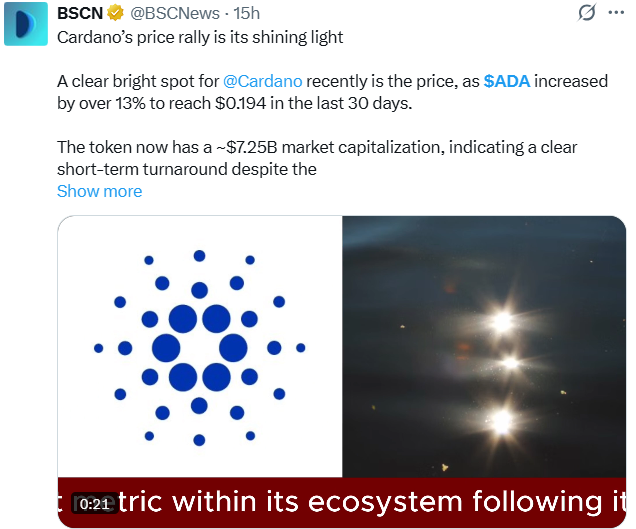
Data source: BSCN
The report also pointed out the stability of online activity. The number of active users recently ranged from 11,000 to 19,000, of which there were approximately 16,857 users and 17,626 transactions on August 8. On the downside, the same report noted that TVL fell nearly 4% in 30 days and 81.7% in the past year, while on-chain fees fell 12% in 30 days, suggesting that this rally is driven more by price momentum than actual DeFi growth.
Note: This section reflects data reported by third party accounts (BSCN). CoinGabbar has not independently verified these data.
Cardano Price Forecast Chart: Technical Analysis
Trading pairs: ADA/USDT ·Markets: Spot (cryptocurrency)·Exchange: KuCoin ·Timeframe: 4 hours·Source: TradingView ·Timestamp: August 12, 2026, 12:09 UTC+5:30
ADA's current trading price is US$0.1859, having previously fallen below the uptrend line that has supported its gains since the end of July. The chart shows a bearish EMA crossing signal at the current price, that is, the 20 EMA has broken below the 50 EMA, which usually indicates that short-term momentum is weakening. The RSI (14) reading at 34.53 is in weak territory and is approaching oversold territory, consistent with the recent retreat from highs near $0.2092.
If prices fall below current support, the bearish trend may continue and the EMA will further increase downward pressure. As long as prices remain below the EMA, any short-term rally can only be seen as a correction rather than a true reversal. But if prices break through the $0.1983 resistance level and cross the EMA, that would be an early signal that the trend may turn bullish. 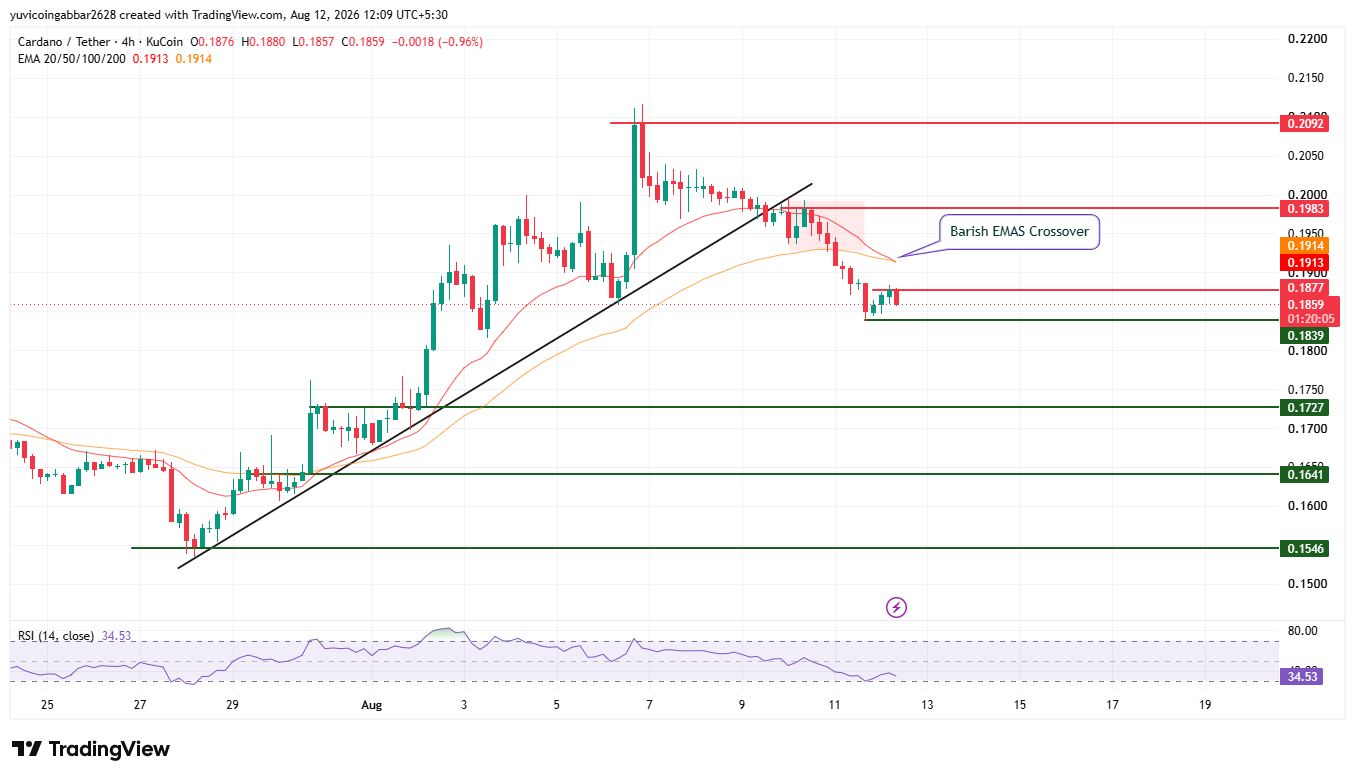
Support and Resistance
Level Type/Price
Resistance 2 / $0.2092
Resistance 1 / $0.1983
Nearest Resistance/ $0.1877
Current Price Reference/ $0.1859
First Confirmed Support/ $0.1839
Deeper Support/ $0.1727
Structural Support/ $0.1641
Structural Bottom/ $0.1546
EMA Level
EMA /Price
EMA 20 / $0.1913
EMA 50 (preliminary recovery level)/ $0.1914
Cardano predicts: Bullish scenario vs. bearish scenario
ADA 2026 price target
Bullish scenario: Maintaining above the first confirmed support level of $0.1839 and regaining the recent resistance level of $0.1877 will relieve the pressure from the bearish crossing. A rebound above the EMA 20/EMA 50 area of US$0.1913 to US$0.1914 will open a path to US$0.1983 and ultimately US$0.2092.
Bear scenario: A break below US$0.1839 would confirm that the bearish cross is working as expected and put the near-term rally in serious doubt. A loss of $0.1727 would make $0.1641 and the subsequent structural bottom of $0.1546 a downside target.
ADA Price Target: Can ADA reach US$0.2092?
US$0.2092 is the highest resistance level marked on the chart. To reach this level, ADA needs to first regain its recent resistance at $0.1877, clear the EMA20/EMA50 resistance in the $0.1913 to $0.1914 region, and then break through and stand firm above $0.1983. This is a multi-stage recovery process, but it looks unlikely to happen while the bearish cross is still in play.
What factors may cause the bullish pattern to fail?
A close below the first confirmed support level of $0.1839 would indicate a bearish cross is forming. A further break below the structural levels of $0.1727 and $0.1641 and $0.1546 would completely undermine the recent rally and signal a deeper correction.
Cardano Price Forecast: Expert Opinion
Analysts believe that the ADA's retreat from recent highs, coupled with a bearish EMA crossing, suggest that short-term momentum has cooled after two weeks of strong gains. The governance vote to fund Cardano PRIME is a real long-term benefit for DeFi liquidity, but if $0.1839 cannot be held, it will not offset the recent technical pressure. BSCN data showed that while prices and user activity remained stable, TVL and on-chain fees were falling, further confirming that this rally relied more on momentum than fundamentals. The US$0.1839 to US$0.1914 range is a key area: regaining this area will ease cross pressure, while losing the area confirms that the bears have regained control of the situation.
Disclaimer : This article is for reference only and does not constitute financial advice. The above prices and scenarios are based on technical chart analysis and public data at the time of writing. The cryptocurrency market may fluctuate violently within hours, so past performance does not guarantee future results. Before taking action based on any of the price points discussed here, it is recommended that you conduct independent research and consider your risk tolerance.