Exchange Ranking
 Top Exchanges
 24h Volume Ranking
 Popularity Ranking
 Exchange BTC Balance
 Proof of Reserves
 Decentralized Exchanges
 Funding Rate
 Funding Heatmap
 Liquidation Data
 Max Pain
 Long/Short Ratio
 Whale L/S Ratio
 Binance/Okex/Huobi L/S
 Bitfinex Margin L/S
 ETF Tracker
 Solana ETF
 XRP ETF
 Hong Kong ETF
 Bitcoin Treasuries
 Crypto Reversal
 Ethereum Reserves
 HyperLiquid Wallet Analysis
 Hyperliquid Whale Watch
 Large Transactions
 On-chain Movement
 Bitcoin ROI
 Stablecoin Market Cap
 Options Analysis
 News
News Articles
 Economic Calendar
 Features
 Wallet
 Contract Calculator


 Security
 Collections
 Watchlist
 Following
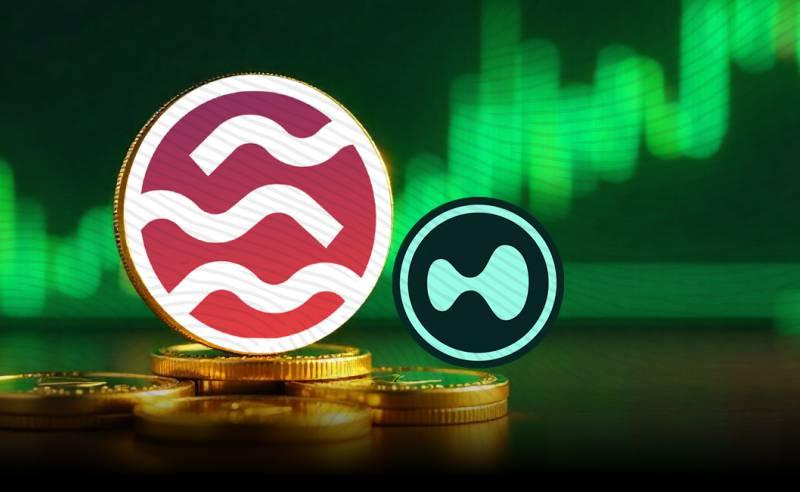
A wallet controls more than half of the supply, yet ARW still skyrockets, and traders are talking about it.
Charts like this are rare, and once they appear, the reasons behind them are often more important than the K-line itself. So, what made this originally unknown Arbitrum token become the focus overnight? Can this rally be sustained?
A small-cap Arbitrum token has traders stopping
There is a reason behind the surge in searches for Arowana price predictions. A token that most people had never heard of last week now behaves as if it was urgent.
Small-cap tokens sometimes do this, and then suddenly explode collectively, similar to an exchange launch announcement that can reverse market sentiment in an instant.
Is this the beginning of a real market, or is it a flash in the pan? Keep this in mind when analyzing data.
Arowana Price Forecast: Current Position of ARW
As of 04:20 UTC on August 12, 2026, the trading price of ARW is US$0.07042, up 130.16% in 24 hours. The market value is approximately $1.61 million, and 24-hour trading volume surged 750% to $44,750. The fully diluted valuation is US$35.21 million, the maximum supply is 500 million units, and the current circulation is 22.91 million ARWs.
The gap between circulating supply and fully diluted valuations is noteworthy and is the same pattern we have highlighted in other recent price forecast analyses. Tokens with small circulation rise and fall quickly.
Current direct resistance is at US$0.0829. Key support is at $0.03107, with a more solid bottom around $0.011.
Why did Arowana prices rise today?
Since July, the downward wedge pattern of ARW has been suppressing the upward breakthrough, and trading volume confirmed this.
We looked at the order flow. In the breakthrough K-line, buying pressure significantly exceeds selling.
But there is a problem here. The RSI on the 4-hour chart just hit 85.39, which is in a severely overbought area. Such hot momentum is often unsustainable, so it is worth checking the calendar of events to see if anything can continue or end the trend.
Arowana Price Forecast: Technical Analysis
Short-term Chart Analysis
The 4-hour structure confirmed a downward wedge breakthrough, with an RSI of 85.39, which is in a severely overbought condition. After bottoming out around $0.0299, the price exceeded $0.0715. The wedge shape, which has been suppressing prices since early July, was eventually broken by buyers.
Trading volume amplifies with price increases, which is the key to distinguishing real breakthroughs from false breakthroughs. Prices are expected to pull back into the US$0.0533 to US$0.0715 range before launching a real shock to US$0.0829 resistance, as such overbought RSI can rarely maintain its slope for more than one or two trading sessions.
Short-term momentum is good for bulls, but the risk of exhaustion is real. If the confirmation of stepping back on the wedge line fails, this judgment will quickly reverse.
Long-term chart analysis
Weekly charts tell a different story. ARW is in a downward channel that has formed since its February high of $0.4522, and prices have fluctuated lower in this channel for most of 2026.
The 20-week exponential moving average (EMA) is at US$0.1057, still above spot prices. This means that no matter how strong the K-line may seem today, the broader trend has not actually been reversed. The weekly RSI is 43.77, indicating kinetic energy neutrality and is not a confirmed reversal signal. The gap between short-term excitement and long-term structure is the key here.
This rally requires the weekly close above $0.16 for the narrative of the downtrend to be truly questioned.
Outlook and market position of the Arowana alternative coin
ARW is an alternative currency governance token on Arbitrum, not a meme. This changes the way you interpret this trend. Governance tokens respond to token economics and platform activities, while pure emocoins are driven solely by hype.
Because ARW is based on the Arbitrum network, its fate is loosely linked to Ethereum network activities. This outlook depends on whether ecosystem incentives are effectively utilized, which is worth tracking in the broader alternative currency news cycle.
ARW Token Economics and Whale Concentration
ARW Overview
Arowana runs on Arbitrum with a total supply of 500 million ARWs. ARW is the governance token behind the Arowana platform and is used to cover participant rewards, ecosystem provisioning and platform expansion.
ARW Allocation
Category| proportion| Quantity (ARW) Ecosystem| 55% |275,000,000 DAO Treasury| 20% |100,000,000 Marketing| 10% |50,000,000 teams and consultants| 10% |50 million communities| 5% |25,000,000 Total| 100% |500,000,000
The supply of each category will be released in batches based on the development stage of the platform.
ARW Value Stabilization Mechanism
ARW is designed to be at the heart of the economic cycle, not just as an ordinary reward token. There are several mechanisms that support this.
Destruction mechanism: Part of the ARW-denominated fees charged by the platform will be destroyed regularly, and the amount destroyed will be adjusted based on platform activities.
Liquidity mining: Early liquidity providers will receive ARW rewards aimed at stabilizing price fluctuations during the maintenance period.
Pledge rewards: Pledging ARW and AGT can withdraw tokens from short-term circulation, reduce selling pressure, and reward long-term holders.
ARW Unlock Plan
Category| initial release| cliff stage| Unlocked ecosystem| 27.5%(137.5 million)| - |48-Month DAO Treasury| 0% | - |48 months of marketing| 2%(10 million)| - |36 months team and consultant| 0% |12 months| 36 months community| 5%(25 million)| - |- Total| 34.5%(172.5 million)| - |65.5%(327.5 million)
Ecosystem and liquidity mining data change with market demand, so it should be regarded as a directional guide rather than a fixed number.
But there is a key issue here. On-chain data shows that the largest single wallet controls 50.42% of the supply, worth approximately US$17.8 million, while the top 100 holders control almost all of the supply. The Gini coefficient is 0.9997.
This single wallet is the real risk behind this Arowana price forecast. The whale leaves, the chart breaks, it's that simple.
Call, fundamentals and bearish scenarios
time frame| bearish scenario| base scenario| Bullish scenario 7 days| US$0.031 (30%)| US$0.055 -0.071 (45%)| 0.083-0.10 USD (25%) 30 days| US$0.020 (25%)| US$0.050 -0.075 (50%)| US$0.135 (25%) early 2027| US$0.015 (30%)| US$0.045 -0.09 (45%)| US$0.16 -0.27 (25%)
Failure condition for a bullish scenario: Daily closing price is below US$0.0503. Failure condition for bearish scenarios: Weekly closing prices are confirmed to be above $0.16.
The main risk currently facing ARW
Liquidity is only 0.01% relative to market value, so even moderate sell orders can cause sharp price fluctuations. Combined with the above-mentioned whale concentration, its volatility risk far exceeds general alternative currency forecasts. Broader regulatory developments may also affect the risk appetite of such thin-liquid tokens.
Disclaimer : This article is for reference only and does not constitute financial, investment, trading or legal advice. Arowana price forecast data, including bullish, basic and bearish scenarios and early 2027 outlook, is analytical estimates based on chart structure, token economics and market data as of August 12, 2026 at 04:20 UTC. They are not guarantees of future performance.
Cryptocurrency markets, especially thin-liquidity tokens like ARW with small liquidity and concentrated whale holdings, carry huge volatility and liquidity risks. Prices can fluctuate significantly at any time without warning. Be sure to research and consult a licensed financial adviser before making any investment decisions.