Exchange Ranking
 Top Exchanges
 24h Volume Ranking
 Popularity Ranking
 Exchange BTC Balance
 Proof of Reserves
 Decentralized Exchanges
 Funding Rate
 Funding Heatmap
 Liquidation Data
 Max Pain
 Long/Short Ratio
 Whale L/S Ratio
 Binance/Okex/Huobi L/S
 Bitfinex Margin L/S
 ETF Tracker
 Solana ETF
 XRP ETF
 Hong Kong ETF
 Bitcoin Treasuries
 Crypto Reversal
 Ethereum Reserves
 HyperLiquid Wallet Analysis
 Hyperliquid Whale Watch
 Large Transactions
 On-chain Movement
 Bitcoin ROI
 Stablecoin Market Cap
 Options Analysis
 News
News Articles
 Economic Calendar
 Features
 Wallet
 Contract Calculator


 Security
 Collections
 Watchlist
 Following
 ADA
ADA Last week's ADA forecast review: Bullish expectations fell short and the market turned under pressure
In last week's ADA weekly forecast, we pointed out that the Cardano price needed to hold on to US$0.190 and recover US$0.200 to maintain buyer control; if it exceeded US$0.211, it was expected to test US$0.220. However, this bullish pattern has not emerged. Instead, the ADA fell below $0.190 to around $0.177, making a bearish scenario of $0.180 or even $0.170 a reality. 0.190 The range to $0.210 also failed to support prices, indicating buyers 'inability to sustain the rally.
Today, ADA prices are trading at US$0.1769 after a daily decline of 1.90%. The question is whether this weakness can continue or whether Cardano can rebound again this week. Charts and network development provide three possible paths.
Low trading volume puts pressure on ADA prices
ADA prices are facing the dilemma of low participation. Trading volumes dried up. In the past 24 hours, volume fell 39% to $112 million, well below the past week's average.
Why is this important? ADA is currently trapped below its seventh-day average price of $0.1848. This indicates that short-term market sentiment is bearish.
If the buyer wants to regain control, it must meet two conditions: first, the transaction volume will rebound to more than US$200 million; second, the price will return to the US$0.1848 line. Without either, sellers will still dominate the market.
The withdrawal of the registration of the Grayscale Cardano Trust ETF on August 7 also deprived the market of a fresh catalyst for institutional demand.
However, there are also dynamics that can boost emotions. The Cardano governance system is preparing for the Dijkstra era, with plans to launch Ouroboros Leios and new transaction and consensus capabilities in two phases. The Cardano Ouroboros Leios progress tracker shows that its preparations to demonstrate 1000 TPS are 96% complete.
Cardano's throughput upgrade is still in testing. The test network is called Musashi Dojo, a tribute to Cardano's Japanese community and philosophy...
Leios Progress Tracker also reports that it is 96% ready for the 1000 TPS test goal. However, governance still faces obstacles: The DRep's approval rate for the new Constitutional Council is only 30% of the required 67%, while the SPO approval rate is less than 1% of its 51% threshold.
Cardano's DRep and SPO are lagging behind in voting to form a new constitutional council. Real-time GovTool data shows that DRep approval rates are 30% of the required 67%, while equity pool operators (SPO) voting rates are below 1% of their 51% threshold, and nearly 99% of SPO pledges have not yet been voted. The action will expire on September 1.
What the Cardano chart shows
We looked at the daily chart, and the first thing that caught attention was the failure of the August rally. ADA prices climbed from a low of about $0.155 in late July to above $0.200 in early August, but encountered resistance around $0.207. Since then, the K-line has formed a series of lower highs, pulling the ADA price back to $0.177. 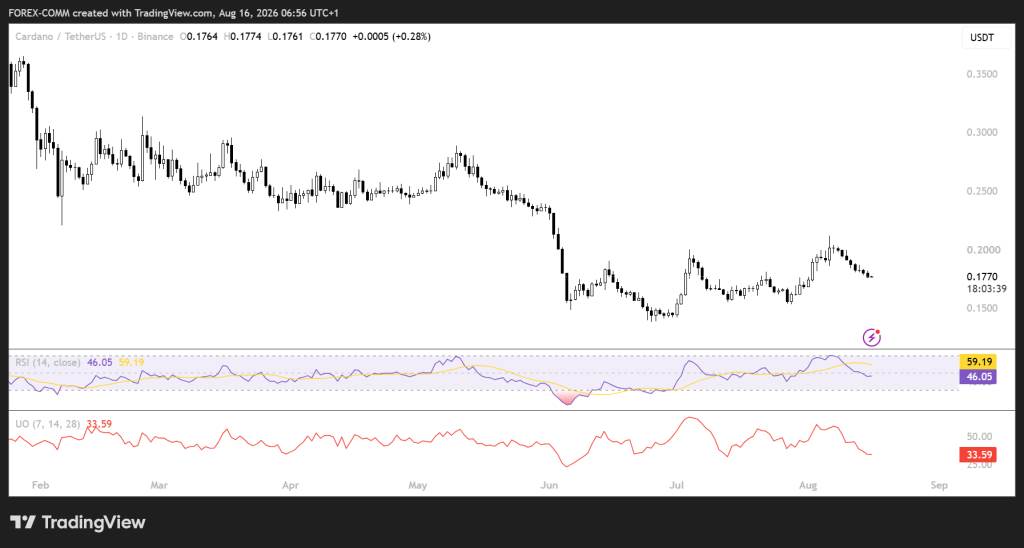
The $0.1848 area is now the first important resistance level as it coincides with the 7-day moving average (SMA). If prices break through that level, buyers will have the opportunity to test $0.190-a level that has been lost in recent declines. After breaking through $0.190,$0.200 will become the next major obstacle, followed by previous resistance around $0.207 to $0.211.
Kinetic energy indicators also prompt caution. The RSI (Relative Strength Index) provides a clear signal: it has dropped significantly from above 60 in early August to 46 today. But the key is this: It has not yet entered oversold areas. The RSI average is currently at 59 and is still below that level, which opens the door for continued decline. The seller has not run out of energy yet.
Let's take a look at the Ultimate Oscillator, which is currently 33.59. A month ago, the indicator was above 50, a huge drop. The only good news? It is still above 25. This level of 25 is usually the critical point for extreme market stretching and we have not yet touched it. As a result, the market does not appear to be weak, but instead seems to have room for further decline.
To reverse Cardano prices, we need to see these indicators pick up first. Until then, any discussion of a rebound has been just empty talk.
Cardano related news:
Cardano leverage pressure data sends a warning signal again
Where will Cardano prices go this week?
Bullish path: ADA needs to recover $0.1848 first and then stand at $0.190. If volume rises above US$200 million and buyers break through US$0.200, ADA prices may target the US$0.207 to US$0.211 range; if this resistance level falls, US$0.220 is expected to hit.
Benchmark scenario: Prices will consolidate again between US$0.170 and US$0.190. Given that the RSI is 46.05, the UO is 33.59, and the volume is only US$112.5 million, the ADA lacks momentum for an immediate breakthrough. The rebound to $0.1848 to $0.190 was blocked again, consistent with this scenario.
Bear path: If US$0.170 falls, US$0.165 and US$0.160 will be exposed to view, continuing the decline that began near the August high of US$0.207. As ADA prices have fallen below the US$0.1848 moving average and momentum indicators have weakened, this remains the main downside risk.
FAQs
Can Cardano (ADA) reach $0.20 this week?
Yes, but ADA first needs to recover $0.1848 and then break through $0.190. A breakthrough of $0.20 may require stronger trading activity, and the article noted that a 24-hour volume of $200 million is an important confirmation level. If it clearly breaks through US$0.20, it may open up space for US$0.22.
If US$0.17 falls, where is the next support level for Cardano (ADA)?
If US$0.17 falls, the next downward support level will be approximately US$0.165 and US$0.160, depending on the chart pattern. Other recent technical analyses point out that if the US$0.17 area cannot be held, the deeper support level is around US$0.155.
Can Cardano (ADA) reach $0.22 this week?
ADA is likely to reach US$0.22 if the buyer first recovers US$0.20 to US$0.202 and then breaks through the resistance zone of US$0.207 to US$0.211. The US$0.22 target is technically feasible, but weak momentum (RSI of 46.05, final oscillator reading as low as 33.59) makes it more difficult to continue breakthroughs in the absence of stronger volume.