Exchange Ranking
 Top Exchanges
 24h Volume Ranking
 Popularity Ranking
 Exchange BTC Balance
 Proof of Reserves
 Decentralized Exchanges
 Funding Rate
 Funding Heatmap
 Liquidation Data
 Max Pain
 Long/Short Ratio
 Whale L/S Ratio
 Binance/Okex/Huobi L/S
 Bitfinex Margin L/S
 ETF Tracker
 Solana ETF
 XRP ETF
 Hong Kong ETF
 Bitcoin Treasuries
 Crypto Reversal
 Ethereum Reserves
 HyperLiquid Wallet Analysis
 Hyperliquid Whale Watch
 Large Transactions
 On-chain Movement
 Bitcoin ROI
 Stablecoin Market Cap
 Options Analysis
 News
News Articles
 Economic Calendar
 Features
 Wallet
 Contract Calculator


 Security
 Collections
 Watchlist
 Following
 SOL
SOL Solana rose 1% in 24 hours and traded above $94 on Monday. The previous week, the cryptocurrency surged 27%, hitting its strongest level in two months.
Institutional demand and network upgrades support SOL
While Solana prices have risen recently, institutional interest has also grown, especially as investment funds focused on SOL have recorded significant capital inflows. According to CoinGlass, major exchange-traded funds focused on Solana-received a total of $28.34 million in new investments for four consecutive trading days last week. This was the largest weekly inflow since June and coincided with a strong rebound in SOL.
The continued inflow of these institutional investment vehicles may put additional buying pressure and further push token prices higher. However, analysts pointed out that a week of positive capital inflows alone does not guarantee the establishment of a long-term trend, and investors are closely watching whether this momentum can continue.
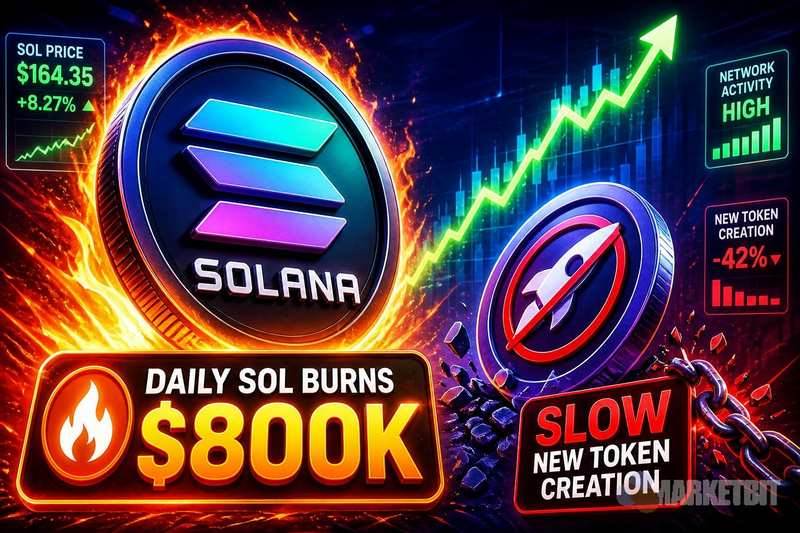
Solana's validators, meanwhile, began voting on three new governance proposals on Monday, and the process is expected to end Thursday. These proposals, labeled SGP1, SGP2 and SGP3, are expected to shape the future of Solana's network. SGP 1 aims to formally ratify the Solana Constitution and lay the foundation for governance and future upgrades. SGP2 attempts to increase the network's deflation rate from 15% to 30%, thereby accelerating the decline in inflation and slowing supply growth without affecting existing supply. SGP3 proposes changes to the transaction fee structure, including the introduction of a fixed base fee paid to block producers and a resource fee based on the computing resources needed for the transaction; the latter would be destroyed, reducing circulation supply. Overall, these updates may affect Solana's governance, economic incentives and technology framework.
Quick search dictionary: Solana verifiers-elected network participants responsible for producing blocks and voting on protocol changes to maintain the integrity and evolution of the Solana blockchain.
Key Resistance and Technical Indicators
Solana's short-term structure remains bullish as prices remain above the main moving average. Current prices are above the 50-day exponential moving average ($79.04) and the 200-day exponential moving average ($92.67), both indicators of positive momentum.
The first resistance facing SOL is $98.41, a recent high set on May 11. The $100 price level also constitutes psychological resistance. A convincing daily close above $100 would be seen as a confirmation of continued recovery and could trigger a further rise to $112.52, which corresponds to the 127.2% Fibonacci expansion since recent lows.
The momentum indicator showed strong buying interest, but also warned of possible short-term consolidation. The 4-hour Relative Strength Index (RSI) is close to 64, approaching the overbought threshold, while the Moving Average Convergence Divergence Indicator (MACD) shows a continuation of bullish sentiment with a positive histogram.
Traders 'current focus is still on whether SOL can clearly break through US$100, and the persistence of ETF inflows and the validator's decisions will affect short-term price movements.
Overview of key indicators
Current price: US$94 (above weekly average)
50-day EMA: US$79.04 (support)
200-day EMA: US$92.67 (support)
4-hour RSI: 64 (near overbought)
Resistance: US$98.41, US$100 (breaking through obstacles)
Fibonacci expansion: US$112.52 (potential target)
ETF inflows: US$28.34 million (rising institutional interest)
On the downside, maintaining prices above the 200-day EMA (US$92.67) will support the bullish outlook. A close below this level could trigger a deeper correction to the 78.6% Fibonacci retracement level of $88.56; if selling pressure intensifies, further decline could reach the 50th EMA ($79.04) or the 50% retracement level of $76.92.
Currently, Solana's bullish outlook remains valid as long as prices remain above key support levels and institutional buying continues to provide a boost to the tokens.