
 Exchange Ranking
 Top Exchanges
 24h Volume Ranking
 Popularity Ranking
 Exchange BTC Balance
 Proof of Reserves
 Decentralized Exchanges
 Funding Rate
 Funding Heatmap
 Liquidation Data
 Max Pain
 Long/Short Ratio
 Whale L/S Ratio
 Binance/Okex/Huobi L/S
 Bitfinex Margin L/S
 ETF Tracker
 Solana ETF
 XRP ETF
 Hong Kong ETF
 Bitcoin Treasuries
 Crypto Reversal
 Ethereum Reserves
 HyperLiquid Wallet Analysis
 Hyperliquid Whale Watch
 Large Transactions
 On-chain Movement
 Bitcoin ROI
 Stablecoin Market Cap
 Options Analysis
 News
News Articles
 Economic Calendar
 Features
 Wallet
 Contract Calculator


 Security
 Collections
 Watchlist
 Following
GWEI plunged more than 60% in a week, and its price plunged 78.75% from its historical high.
ETHGas is a protocol that converts Ethereum block space into a tradable market. Its governance token, GWEI, drives the entire system through pledge and voting mechanisms. Such a sharp price drop naturally makes people look for ETHGas's price forecasts to try to determine whether the worst period is over. At present, charts and on-chain data show that sellers still dominate, clearing volumes on major exchanges are accumulating, and trading volumes are drying up.
ETHGas price forecast: Market Overview
Indicators--Values- 24-hour changes
Price--Down-15%
Market capitalization--$107.5 million
Fully diluted valuation--$512 million
24-hour trading volume--$6.9 million (month-on-day decline of 44-70%)
Circulation Supply--$2.1 billion GWEI
Total Supply/Maximum Supply--$10 billion GWEI
Historical High Price-- $0.2444 (Currently down 78.75%)
Historical low-- $0.01668 (currently up 211%)
Data source: CoinGecko
ETHGas News: Why is the ETHGas cryptocurrency plummeting?
The main reason for this plunge was not hacking or concealment, but due to Ethereum itself. Gas fees on the Ethereum network have dropped to their lowest level this cycle, and its price has fluctuated within only a fraction of a Gwei in most recent days. Since GWEI's entire value story is based on Ethereum blockchain space and Gas needs, a deserted chain activity directly undermines the token's practical narrative. Combined with this week's overall slowdown in demand for altcoins, GWEI has nowhere to hide. Its low circulation supply of only 21% also contributed to the flames. Because the number of actively traded tokens is small, even moderate selling pressure can cause price fluctuations to be more dramatic than in deeper markets. This combination of "sluggish on-chain activity + insufficient liquidity + weak altcoin sentiment" is the reason why the correction turned into a sharp decline.
ETHGas clearing data and trading volume heat chart
In the past 24 hours, the total clearing amount was $127,960, of which long positions suffered heavy losses, reaching $100,950, while short positions were only $27,000. 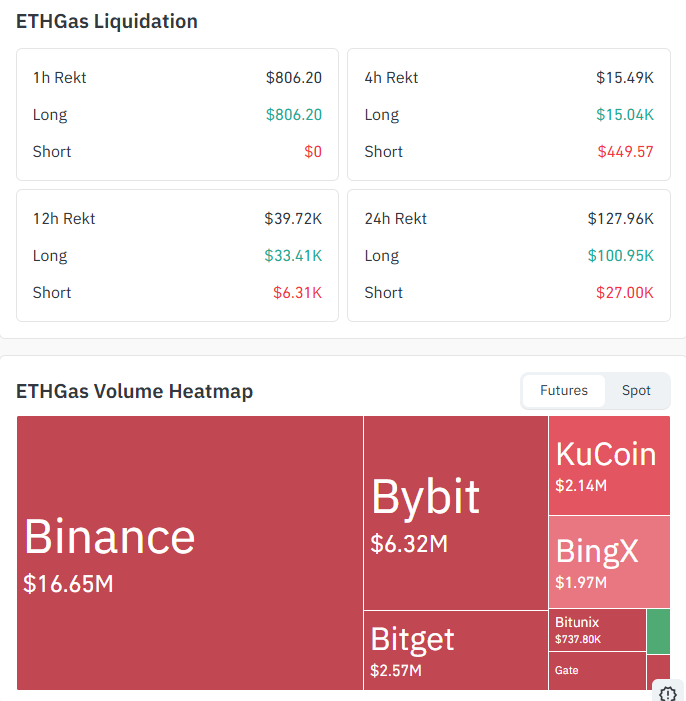 This suggests that traders betting on a rebound in prices are constantly being stopped. Most trading volume was concentrated in Binance ($16.65 million), followed by Bybit ($6.32 million), Bitget ($2.57 million) and KuCoin ($2.14 million). This concentration on a few trading platforms means that prices fluctuate rapidly once large orders appear.
ETHGas Price Forecast: Short-term Chart Analysis
On the 1-hour chart, GWEI traded at $0.051414, well below its 20, 50, 100 and 200 index moving averages. 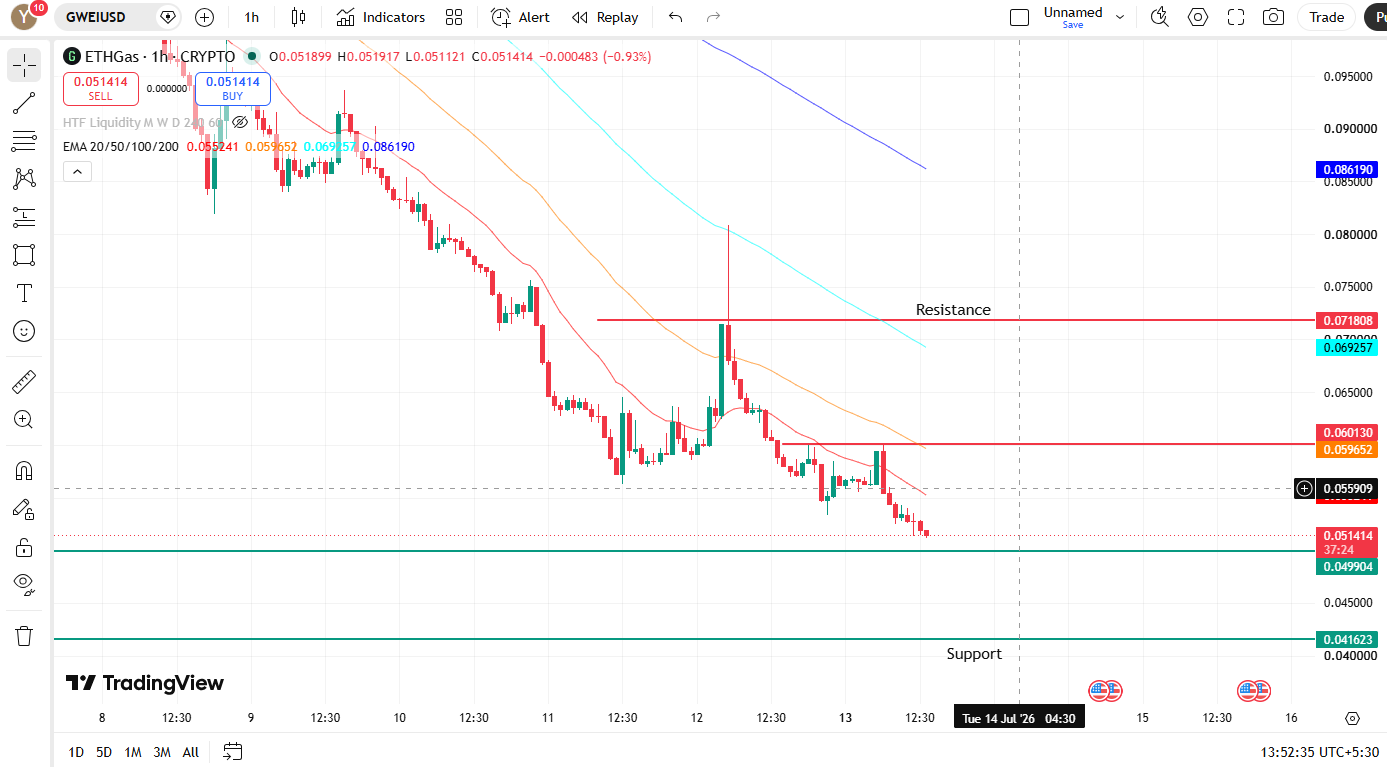 This clearly shows that the seller still has the initiative. So far, every attempt to rebound to resistance has been suppressed by selling.
ETHGas Price Forecast: Short-term Key Price Observation
Key Price--Price
Resistance-- $0.0601
Resistance-- $0.0718
Support-- $0.0499
Deeper Support--- $0.0416
As long as the price is still lower than the EMA cluster, the first price to pay attention to is $0.0499.
ETHGas Price Forecast: Long-term Chart Analysis (Daily)
Daily Chart presents a more macro picture. 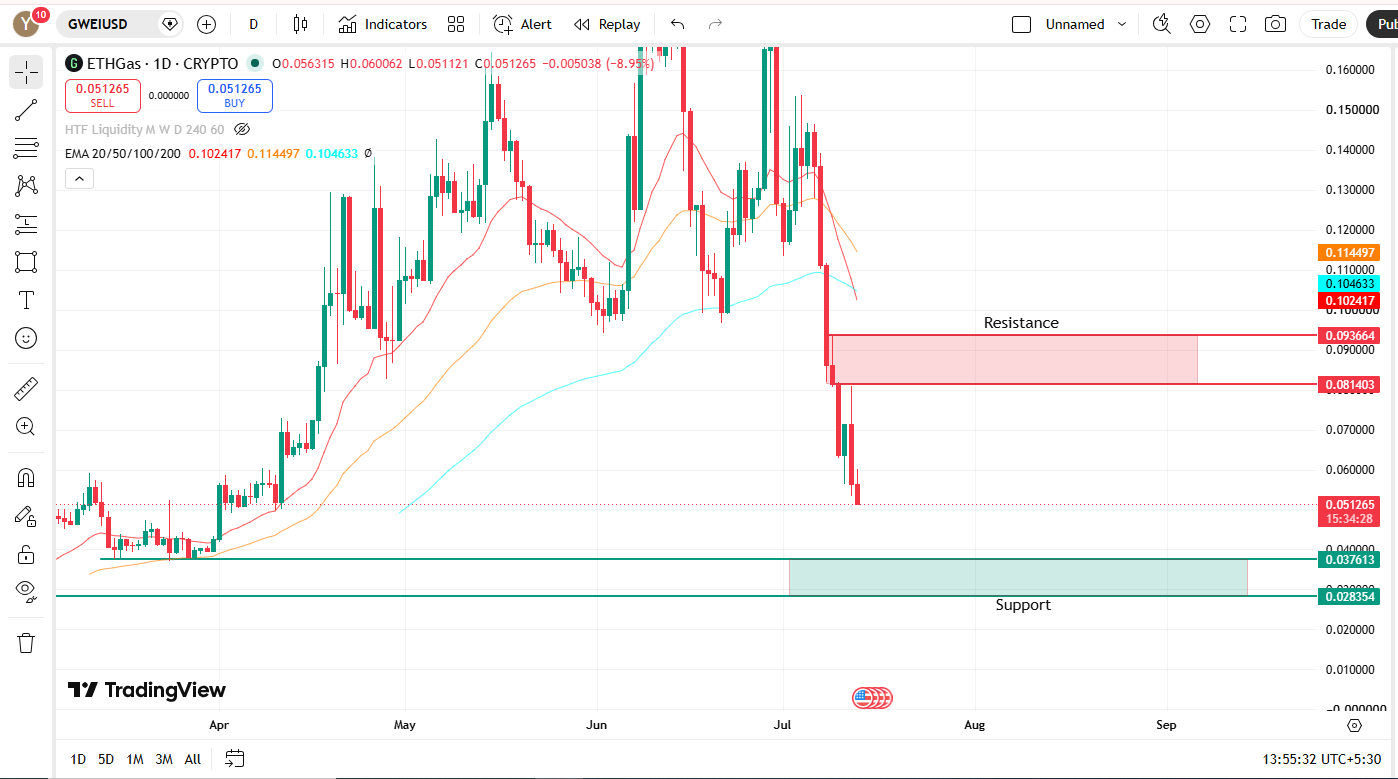 GWEI fell nearly 15% in a single day and is currently at a key support level. The daily chart shows a "dead cross" between 100 EMA ($0.104633) and 50 EMA ($0.1144). As long as prices remain below that intersection, any rise is just a rebound, not a trend reversal; prices may re-test resistance, but may still fail in the end. Only when the price returns to 100 EMA and the intersection turns into a "golden cross" can a true trend reversal be confirmed. Until then, the overall structure will remain bearish.
ETHGas Price Forecast: Long-term Key Price Observation
Key Price-Price
Resistance Zone-- $0.081403
Resistance Zone-- $0.09366
Support Zone-- $0.037613
Support Zone-- $0.028354
ETHGas Price Forecast: Expert Opinion
Market analysts believe that the data shows that the token is still looking for a bottom. If the daily chart holds above $0.0376, it will be the first real signal that demand is stabilizing. A fall below this level may open up room for downside to the $0.028354 area. On the upside side, if the $0.0610 resistance level can be regained on the 1-hour chart, it will be an initial sign of weakening seller power in the short term.
Disclaimer : This document is for information purposes only and does not constitute financial advice. The cryptocurrency market is extremely volatile; please study for yourself before investing.






















