
 Exchange Ranking
 Top Exchanges
 24h Volume Ranking
 Popularity Ranking
 Exchange BTC Balance
 Proof of Reserves
 Decentralized Exchanges
 Funding Rate
 Funding Heatmap
 Liquidation Data
 Max Pain
 Long/Short Ratio
 Whale L/S Ratio
 Binance/Okex/Huobi L/S
 Bitfinex Margin L/S
 ETF Tracker
 Solana ETF
 XRP ETF
 Hong Kong ETF
 Bitcoin Treasuries
 Crypto Reversal
 Ethereum Reserves
 HyperLiquid Wallet Analysis
 Hyperliquid Whale Watch
 Large Transactions
 On-chain Movement
 Bitcoin ROI
 Stablecoin Market Cap
 Options Analysis
 News
News Articles
 Economic Calendar
 Features
 Wallet
 Contract Calculator


 Security
 Collections
 Watchlist
 Following
 TRX
TRX TRX Price Analysis: Breaking through the downtrend line, institutional support strengthens
The current TRX trading price is approximately US$0.3269, rising slightly within the day. Previously, the currency broke through the downtrend line and maintained this trend for nearly 16 hours. This TRX price forecast will analyze the strength of this breakthrough structure and the latest institutional dynamics surrounding Anchorage Digital's expansion of its TRX custody and pledge support. Combining chart form with growing institutional support helps determine the next step for TRX.
Coinglass data shows: Current TRX price
Current price: US$0.3269
Market value: US$30.98 billion
Futures volume (24 hours): US$164.75 million
Spot volume (24 hours): US$47.55 million
Open interest: US$240.9 million
Circulation supply: 94.86 billion TRX
Total supply: 94.86 billion TRX
Today's TRX News
According to X platform user Goddie, Anchorage Digital, the first federally chartered crypto bank in the United States, has expanded its TRX DAO integration. New native TRX pledge support and custody services for TRC-20 assets. 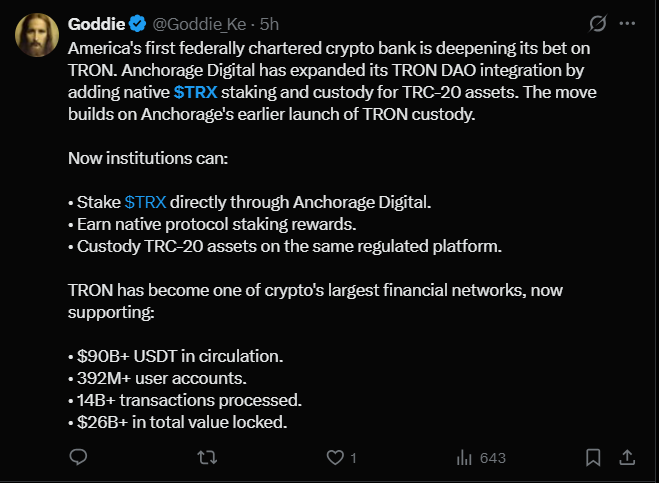 Previously, Anchorage has launched TRX custody services, and now institutional users can directly make TRX pledges, obtain native agreement pledge rewards, and custody TRC-20 assets on this regulated platform. This is significant for any TRX price forecast, as TRON now supports more than $90 billion in USDT circulation, more than 392 million user accounts, and more than $26 billion in total lock-in value.
TRX Price Forecast: Technical Analysis
On the 1-hour chart, TRX has been moving along the downtrend line, hitting a lower low every time it is touched. 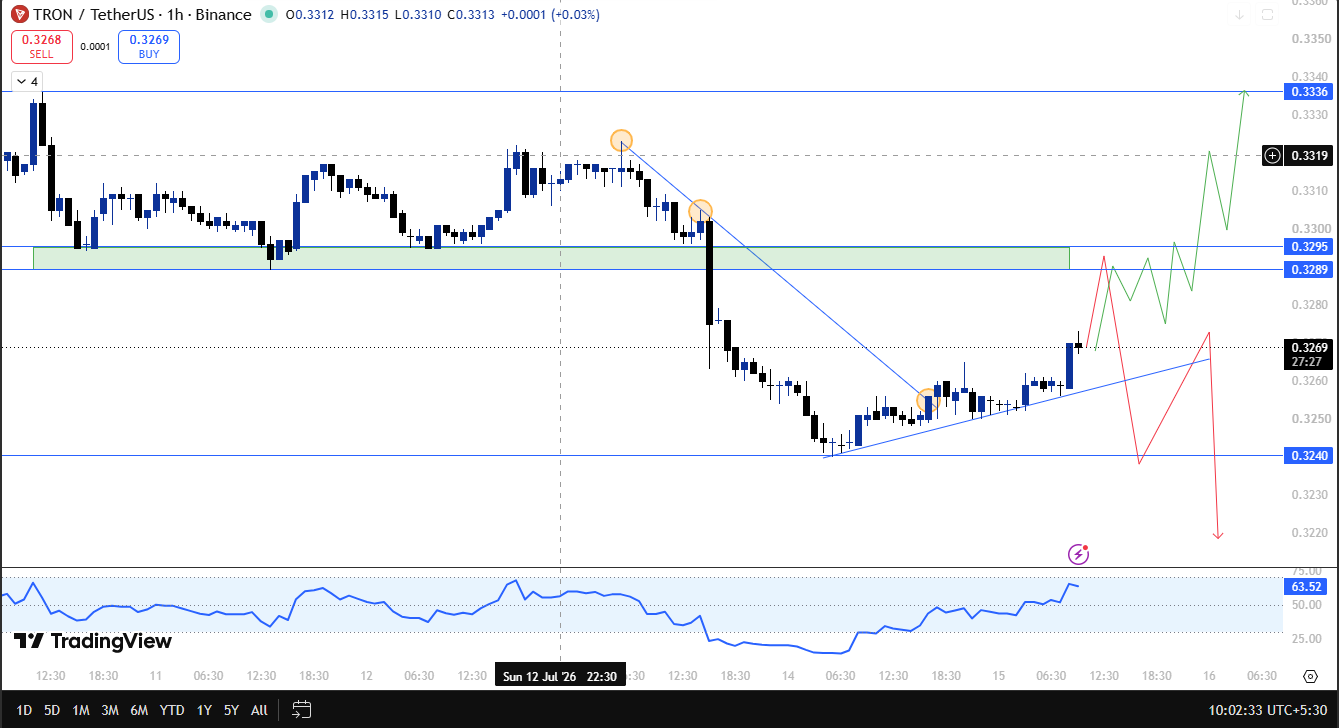 The second touch brought huge selling pressure and the price fell sharply. However, on the third touch, selling pressure did not appear, and TRX was not blocked again, but broke through directly.
Since the breakthrough, TRX has maintained this trend for nearly 16 hours. About an hour ago, a strong bullish candle line formed from the uptrend line, further strengthening the pattern.
If TRX successfully closes above $0.3295, the next resistance level is in the range of $0.3320 to $0.3336.
On the downside, if prices fall below the current uptrend line, support is at US$0.3240 and below. If the TRX has a one-hour candle line that closes directly below $0.3240, the breakthrough pattern will expire.
TRX Support and Resistance
Resistance: US$0.3336
Direct Resistance (Breakthrough Trigger Point): US$0.3295
Flip zone: US$0.3289 - 0.3295
Support/failure level: US$0.3240
Risks and returns: Objective version
Bullish scenario: The $0.3289 -0.3295 flip zone maintained support and TRX closed above $0.3295, opening a path to $0.3336.
Bear situation: The candle line shadow fell below the zone but no close was confirmed; the price lingered above US$0.3240 but did not break below.
Bullish scenario: The US$0.3240 support level can be held even under pressure, keeping the breakthrough structure intact.
Bear situation: There is a direct 1-hour candle line closing below US$0.3240, and the pattern is invalid.
The above analysis combines the short-term chart structure with the latest TRX news and should not be regarded as a guarantee of future performance.
Failure level
The entire breakthrough structure depends on whether TRX can remain above US$0.3240. Even if the price falls below the flip zone of US$0.3289 to US$0.3295 (hatching only), it may still be absorbed; but if the confirmed one-hour candle line closes below US$0.3240, the pattern will completely fail, and TRX will likely need to bottom again before attempting to break through again.
Expert opinion
Traders following TRX's short-term movements believe that the failure to sell when the trend line is hit for the third time is a fairly obvious signal. When sellers suddenly withdraw before a breakthrough, it usually means that selling pressure has exhausted.
TRX has maintained this trend for nearly 16 hours and formed a strong bullish candle line just an hour ago. Therefore, the overall sentiment surrounding this TRX price forecast is currently biased towards cautiously bullish.
Most traders following TRX price movements believe that a close above US$0.3295 will be a real confirmation signal, which will open up space for a rise to US$0.3336. On the other hand, a confirmation below $0.3240 would almost completely destroy the pattern.
The growing institutional attention from Anchorage Digital has also added more weight to bullish views, giving this TRX price forecast additional support beyond the chart.
Disclaimer : This article is for reference only and does not constitute financial advice. The cryptocurrency market is highly volatile and price forecasts are not guaranteed. Please study for yourself before making any investment decisions.






















