
 Exchange Ranking
 Top Exchanges
 24h Volume Ranking
 Popularity Ranking
 Exchange BTC Balance
 Proof of Reserves
 Decentralized Exchanges
 Funding Rate
 Funding Heatmap
 Liquidation Data
 Max Pain
 Long/Short Ratio
 Whale L/S Ratio
 Binance/Okex/Huobi L/S
 Bitfinex Margin L/S
 ETF Tracker
 Solana ETF
 XRP ETF
 Hong Kong ETF
 Bitcoin Treasuries
 Crypto Reversal
 Ethereum Reserves
 HyperLiquid Wallet Analysis
 Hyperliquid Whale Watch
 Large Transactions
 On-chain Movement
 Bitcoin ROI
 Stablecoin Market Cap
 Options Analysis
 News
News Articles
 Economic Calendar
 Features
 Wallet
 Contract Calculator


 Security
 Collections
 Watchlist
 Following
 ADA
ADA Today's Cardano price forecast shows cautious stability in the market, with ADA trading at around US$0.1645, down slightly in the past 24 hours. The trend of Cardano's price forecast is influenced by a well-tested flip zone located around $0.1649 to $0.1656. Current prices are trading near this flip zone and traders are looking for the next directional breakthrough.
Cardano Market Snapshot
Price: US$0.1645
24-hour Change: -0.84%
1-hour Change: -0.60%
Market Value: US$6.03 billion
Futures volume (24 hours): US$241.74 million
Spot volume (24 hours): US$29.74 million
Open interest: US$387.28 million
Circulation supply: 36.48 billion ADA
Total supply: 44.99 billion ADA
Maximum supply: 45 billion ADA
Cardano's latest news
According to sources, Cardano has just activated the Van Rossem hard fork to upgrade the network to protocol version 11. The team said this was the first upgrade to be fully approved by on-chain governance.  This update brings new Plutus feature and cost model improvements aimed at reducing smart contract execution costs while laying the technical foundation for the upcoming Dijkstra era. This governance-driven release marks a shift in the way Cardano approves changes to major agreements in the future.
Cardano Clearing Data
ADA Clearing Data shows that bulls are under major pressure in most time frames. 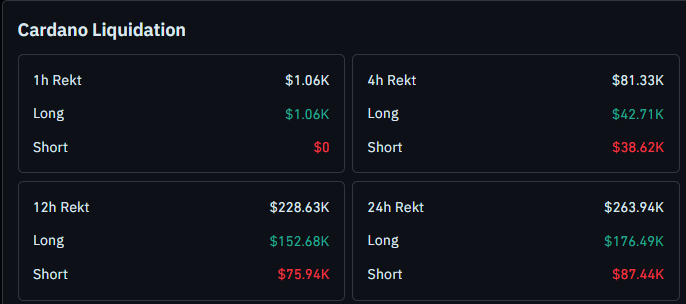 In the past hour, long positions were cleared by US$1.06,000, and no short clearing was recorded. Within the 4-hour window, the total liquidation amount was US$81.33 thousand, of which US$42.71 thousand was long and US$38.62 thousand was short. Within 12 hours, the liquidation amount rose to US$228.63 thousand, with long positions of US$152.68 thousand and short positions of US$75.94 thousand. In the past 24 hours, the total liquidation amount reached US$263.94 thousand, with long positions of US$176.49 thousand and short positions of US$87.44 thousand. This suggests that leveraged bulls have taken a bigger hit as the ADA has retreated from recent highs.
Cardano Price Forecast: Technical Outlook
On July 8, ADA prices approached a support area and gained support from this area four times. 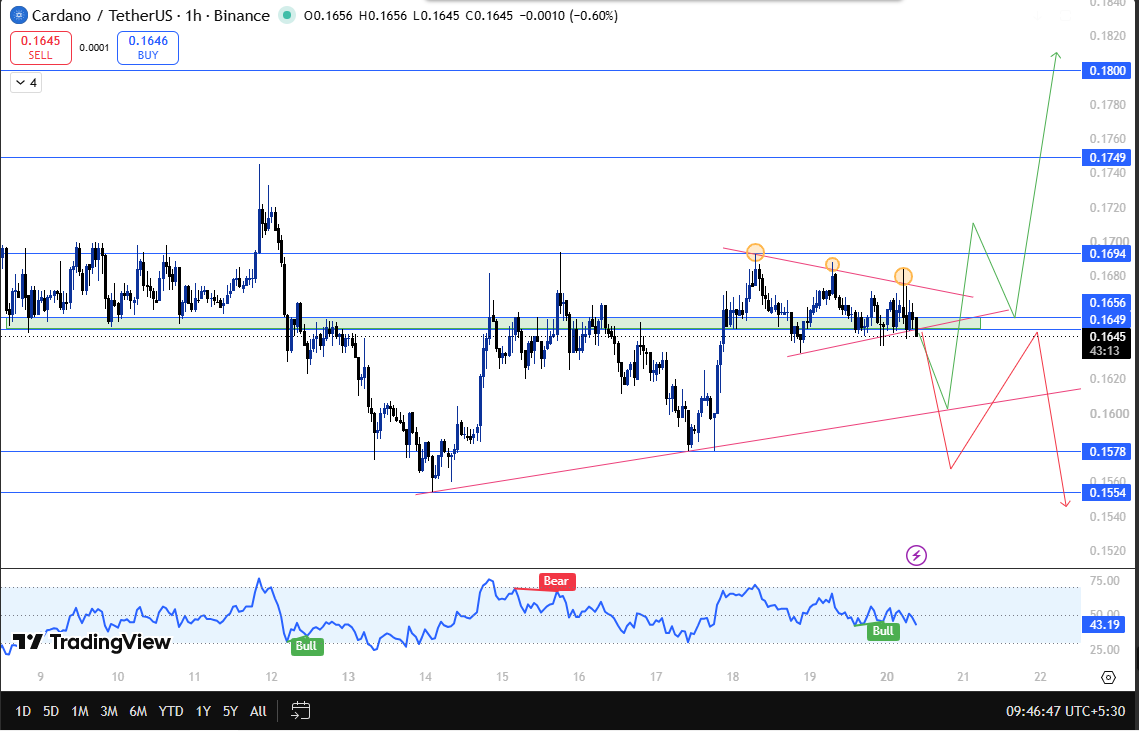 The fourth rally produced the strongest upward trend of the four, pushing prices sharply higher. After rising, prices fell back and fell below the same area, which no longer served as support but began to act as resistance. The shift turned the area into a so-called flip zone, roughly between $0.1649 and $0.1656.
Once the price fell below the flip zone, the buyer tried to pull it back directly, but failed to hold on, and the seller took control of the situation and lowered the price more violently. The price hit $0.1578 and tried to rebound, but sellers stepped in again to drive it down further. Buyers then became active around $0.1554, pushing prices directly above the area, but failed to close on it. Sellers drove prices down again, buyers pulled them up again, and prices remained close to the area.
Buyers once again pushed past recent highs, but also failed to close above them, and the price fell back to around $0.1578. This level once again served as support, and buyers used it to push prices back above the flip zone, and it has remained there to this day.
Currently, ADA is trading within a range that appears to be an expanding wedge, forming an upward supporting trend line from the lower left corner of the chart, forming a V-shaped structure with recent lows. Currently, the ADA has broken through this expansion wedge downward; if it continues, prices may fall along the supporting trend line. If you reverse from this trend line, it will move higher towards the marked resistance level, with $0.1800 being the larger target.
If the price breaks below $0.1578 and closes below it, it will be considered rejected from the flip zone and the ADA may fall back to $0.1554 or even lower.
ADA Support and Resistance Level
Type| level| Description
Resistance 2| $0.1800| If resistance is exceeded, a larger upward target
Resistance 1| US$0.1694 - 0.1749| The next resistance zone above the current price
current price| $0.1645| Trading near the flip zone
Support 1| US$0.1649 - 0.1656| Flip area, recovered and serves as support
Support 2| $0.1578| Recurrent wedge support is the key level of
support3| $0.1554| Deeper support, buyers were active here before
ADA Risk-Return Table
Situation| trigger condition| Target
Bullish scenario| Hold on to the 0.1649 to 0.1656 $flip zone and 0.1578 $support, then break through the expansion wedge and break through 0.1694 to 0.1749 $|Move towards US$0.1800
Bear situation| Lost support in the flip zone and closed below $0.1578| Falling towards $0.1554 and below
failure levels| If Cardano closes below $0.1578 on strong volume, the bullish structure will expire as it will indicate that flip zone support has failed, opening up room for further declines to $0.1554 and below.
Expert opinion
A market analyst said Cardano is currently trading just above a key flip zone that has been tested and defended multiple times. US$0.1578 is noteworthy because it has repeatedly served as a bottom in recent pullbacks, breaking through the wedge shape and crossing the US$0.1694 to US$0.1749 resistance zone, potentially opening a channel towards US$0.1800. With the launch of the Van Rossem hard fork and the activation of version 11 of the protocol, network upgrades add fundamental background to the technical side, but price movements near the flip zone could determine the ADA's next major direction in the next few trading days.
Disclaimer : This document is for information purposes only and should not be regarded as financial advice. The cryptocurrency market is highly volatile and price forecasts are not guaranteed. Please research for yourself before making any investment decisions.






















