
 Exchange Ranking
 Top Exchanges
 24h Volume Ranking
 Popularity Ranking
 Exchange BTC Balance
 Proof of Reserves
 Decentralized Exchanges
 Funding Rate
 Funding Heatmap
 Liquidation Data
 Max Pain
 Long/Short Ratio
 Whale L/S Ratio
 Binance/Okex/Huobi L/S
 Bitfinex Margin L/S
 ETF Tracker
 Solana ETF
 XRP ETF
 Hong Kong ETF
 Bitcoin Treasuries
 Crypto Reversal
 Ethereum Reserves
 HyperLiquid Wallet Analysis
 Hyperliquid Whale Watch
 Large Transactions
 On-chain Movement
 Bitcoin ROI
 Stablecoin Market Cap
 Options Analysis
 News
News Articles
 Economic Calendar
 Features
 Wallet
 Contract Calculator


 Security
 Collections
 Watchlist
 Following
 DEXE
DEXE DEXE Today's Price: Market Overview
Indicators
Price $2.3171
24-hour price rise and fall-34.7%
24-hour range $1.57 - $3.92
Market cap $221.03M
Fully diluted valuation $221.03M
24-hour trading volume $210.165M
Circulation supply 96.505M $DEXE
Total supply 96.505M $DEXE
Clearing and trading volume data
Clearing data shows a mixed trend according to time period. In the past 1 hour and 4 hours, short sellers have suffered greater losses (short sellers 'liquidation volume within 1 hour was $142.62K, accounting for the total amount of $148.89K; short sellers' liquidation volume within 4 hours was $314.57K, accounting for the total amount of $409.75K), indicating that short sellers have been squeezed recently. However, in the past 12 hours and 24 hours, long liquidations have exceeded: long liquidations of $2.41M and short liquidations of $1.88M within 24 hours, reflecting the overall trend of plummeting from $49.
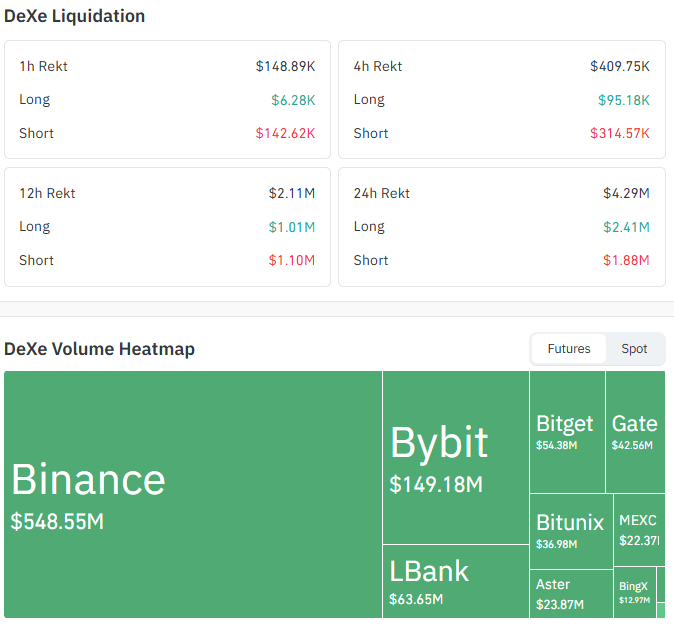
In terms of futures trading volume, Binance is far ahead with $548.55M, Bybit is $149.18M, and LBank is $63.65M, indicating that this round of market mainly occurs in leveraged trading on the largest exchanges.
DEXE Today's News: Why the price of DEXE fluctuates
The trend of DEXE stems from the listing catalytic event around July 9, which triggered a round of gains. Subsequently, between July 10 and 13, traders shorting the token were forced to cover, resulting in a short squeeze that pushed the price to the all-time high of about $49 on July 13. Since then, the token has given up almost all of its gains.
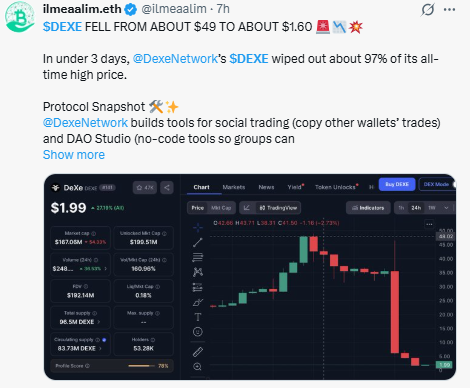
In addition, there have been posts circulating on social media claiming that a large number of $DEXE tokens were transferred from the team-associated wallet to Binance. Some interpreted this as a team sell-off, while others claimed that this involved tokens from stolen wallets. Neither claim has been confirmed or independently verified by DeXe Network, and there are currently no confirmed hacking or smart contract vulnerabilities. Until DeXe Network issues an official statement, these should be treated as unconfirmed allegations on social media rather than confirmed facts.
DEXE Price Forecast: Chart Analysis
DEXE has been in a steep downtrend since peaking, marked by a downtrend line that extends from historical highs to current prices. After an initial sharp decline, prices consolidated laterally between about $4.3908 and the higher range of $0.0516 (50-index moving average), then fell below that range, breaking through the $3.8111 level, and continued to fall until finding support around $1.9200. Prices are currently trying to bottom here and rebound upwards to test the downtrend line; if they can break through, there may be a sharp rise.
Index moving average readings (20: 2.3529, 50: 5.0516, 100: 11.4547, 200: 19.6224) confirm that prices are well below all major moving averages, and that the moving averages are in a steep bearish ranking, consistent with the current active downtrend.
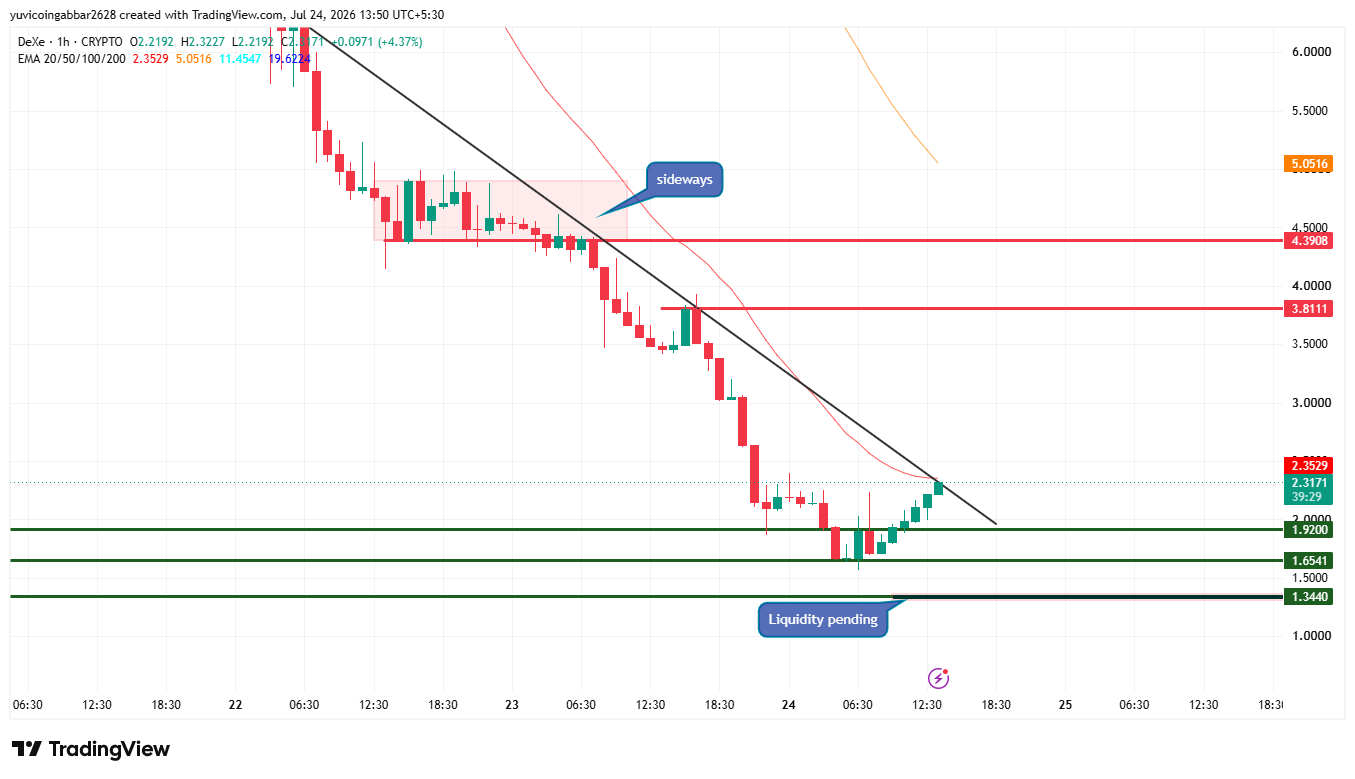
The downtrend line is the immediate level that prices need to break through to achieve a real structural transformation.
Key price
Price type price
$4.3908 Resistance level Top of previous horizontal consolidation range
$3.8111 Resistance level Break level of horizontal consolidation range
$2.3171 Spot reference price Current price, Test the downtrend line from below
$1.9200 First support level Recent bottoming area
$1.6541 Next support level if $1.92 falls next level after falling
$1.3440 Deeper support Deep liquidity area below the current structure
Price scenario
Bullish scenario: target of $3.8111, trigger condition: break through and stabilize the downtrend line and the $1.92 support level, and increase in trading volume, time frame: 3 to 7 days, expiration condition: close below $1.9200.
Baseline scenario: range from $1.9200 to $3.8111, trigger condition: price consolidation is sideways, no clear break through the trend line, time frame: 3 to 7 days, expiration condition: daily close out of either side of the range.
Bear scenario: target of $1.3440, trigger condition: break below $1.9200 and continue to liquidate long, time frame: 3 to 7 days, expiration condition: recover $1.9200 as volume increases.
Two scenarios: rebound vs break
rebound scenario: If DEXE breaks through the downtrend line and stands above $1.9200 with increased trading volume, the next test level will be a break of $3.8111. If momentum continues, look further at $4.3908. This view expires if the daily closing price falls below $1.9200 again.
Break scenario: If $1.9200 fails to hold, DEXE risks falling to the level of $1.6541 first. If the sell-off continues, the target is a deeper liquidity area of $1.3440. The failure condition for this view is that the price recedes $1.9200 if volume increases.
Risk warning
DEXE remains highly volatile, retreating about 97% from recent historical highs, initially driven by short squeeze rather than organic demand. Unconfirmed allegations on social media about wallet movements have further added to uncertainty. Before DeXe Network responds directly to these allegations, please treat relevant headlines with caution and not confuse them with confirmed price data.
DeXe Technical Analysis: Expert Opinion
Charts and clearing data indicate that the market is still digesting the consequences of short-jacked-driven surges and plunges, and are not confirmed hacking or team selling. Recent short liquidations within the 1-hour and 4-hour windows suggest some short-term relief, but prices are still well below the moving averages of all major indices and in a clear downward trend. A real reversal requires prices to stay firm above the downtrend line and the $1.9200 support level, and it would be best if DeXe Network issued an official response to the wallet diversion allegations.






















