
 Exchange Ranking
 Top Exchanges
 24h Volume Ranking
 Popularity Ranking
 Exchange BTC Balance
 Proof of Reserves
 Decentralized Exchanges
 Funding Rate
 Funding Heatmap
 Liquidation Data
 Max Pain
 Long/Short Ratio
 Whale L/S Ratio
 Binance/Okex/Huobi L/S
 Bitfinex Margin L/S
 ETF Tracker
 Solana ETF
 XRP ETF
 Hong Kong ETF
 Bitcoin Treasuries
 Crypto Reversal
 Ethereum Reserves
 HyperLiquid Wallet Analysis
 Hyperliquid Whale Watch
 Large Transactions
 On-chain Movement
 Bitcoin ROI
 Stablecoin Market Cap
 Options Analysis
 News
News Articles
 Economic Calendar
 Features
 Wallet
 Contract Calculator


 Security
 Collections
 Watchlist
 Following
 DEXE
DEXE DeXe price forecast debate intensifies, as $DEXE continues to compress within a downward wedge.
Bulls are hit hard with every decline, and prices are approaching a key level that may determine the trend in the next few days. No matter how this wedge eventually breaks through, the fluctuations will never calm down.
$DEXE Current Price and Market Overview
Price: $2.849
24-Hour Change: -13.55%(-$0.4461)
Market Value: $249.93M
Futures Volume (24 hours):$927.23M
Spot Volume (24 hours):$109.31M
Open interest: $53.92M
Liquidity Supply: 83.73M DEXE
Total supply: 96.50M DEXE
Maximum supply: 98.94M DEXE
The above prices are taken from the real-time TradingView chart. Trading volume, market value, open interest and supply data are derived from DeXe data, as of 01:49 on July 27, 2026.
Methodology and Data Sources
This $DEXE technical analysis uses a 1-hour chart of DEXE/USDT on Binance (Get the price structure through TradingView), volume, open interest and market value data are from CoinGlass, and clearing flow data are from CoinGlass's DEXE clearing tracker. Failure determinations for all levels are based on the confirmed 1-hour candle closing price (rather than the intraday shadow) exceeding the stated trigger point.
Quick overview
DEXE is currently trading around $2.849 on a 1-hour chart. If the close is confirmed and continues to stand above $3.924, accompanied by strong trading volume, it is expected to move towards $5.142 and $6.468; conversely, if the downward wedge breaks, the focus will shift to the $1.287 support area. This is a short-term judgment. If the price clearly breaks through any level, it should be reviewed again.
Why DEXE prices fell today
$DEXE fell 13.55% in the past 24 hours, and the clearing data below clearly shows which traders are on the wrong side of this volatility. As prices continue to fall within the wedge, long positions are repeatedly purged, which is in line with the typical characteristic of market bargainers entering early during the compression phase rather than waiting for actual confirmation. Such $DeXe price forecast settings tend to depend more on which side of the wedge breaks first than on the news side, so the level of breakthrough based on trading volume is particularly important here.
$DEXE clearing data and long-short squeeze
The clearing flow over the past day has been heavily biased towards the bulls, which clearly shows that buyers trying to bottom out within the wedge have repeatedly gone wrong. 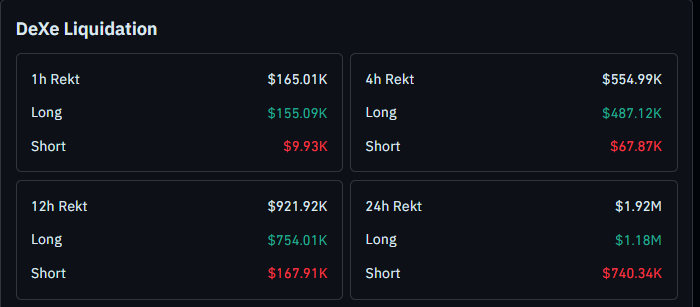 In the past hour, a total of $165.01K was cleared, of which $155.09K was cleared for long positions and only $9.93K for short positions. The 4-hour window shows the same trend, with a total of $554.99K. In the clearing, long positions accounted for $487.12K and short positions accounted for $67.87K. Expanding to the 12-hour window, the total liquidation amount was $921.92K, with bulls occupying an overwhelming share of $754.01K and short positions accounting for $167.91K. In the past 24 hours, the total liquidation amount reached $1.92M, of which the long positions accounted for $1.18M and the short positions accounted for $740.34K.
The continued long-dominated tilt within each time window suggests that the market continues to trap buyers as it declines, which is consistent with the declining wedge structure that is forming on the chart. Full clearing data can be viewed in the DEXE clearing dashboard above.
$DEXE Exchange Trading Volume Distribution
Currently, DEXE futures trading is highly concentrated on a few exchanges. 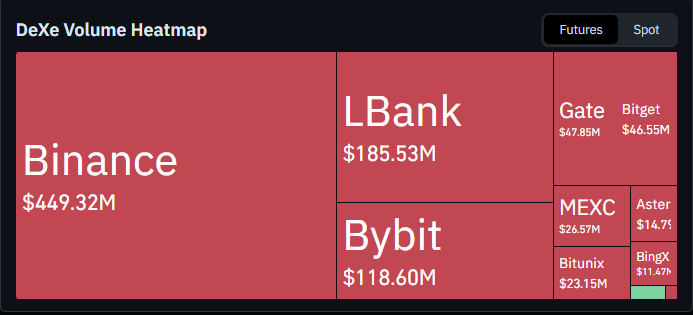 Binance is far ahead with 24-hour futures trading volume of $449.32M, followed by LBank ($185.53M) and Bybit ($118.60M). Gate and Bitget both had transaction volumes of around $40 million, while MEXC, Bitunix, Aster and BingX contributed smaller shares. This concentration on one or two major exchanges means that large orders placed in Binhang often have a disproportionate impact on Dexe's next trading direction.
$DEXE holder concentration and whale risk
In addition to the chart itself, the concentration of holders of $DEXE is also worthy of attention, especially for traders participating in this DeXe price forecast. The top 100 wallets control 99.96% of supply, while whale wallets, which account for only 0.05% of all owners, account for 99.63% of the market value. The Gini distribution score is 0.9999, and there are 11 independent holders each having at least 1% of the total supply.
By level, there are only 22 whale wallets, but they control the vast majority of the tokens. The Shark Wallet has another 12 holders, controlling 0.24%. The remaining levels (dolphins, fish, crabs, shrimp) cover tens of thousands of holders, but only hold a very small share in total. 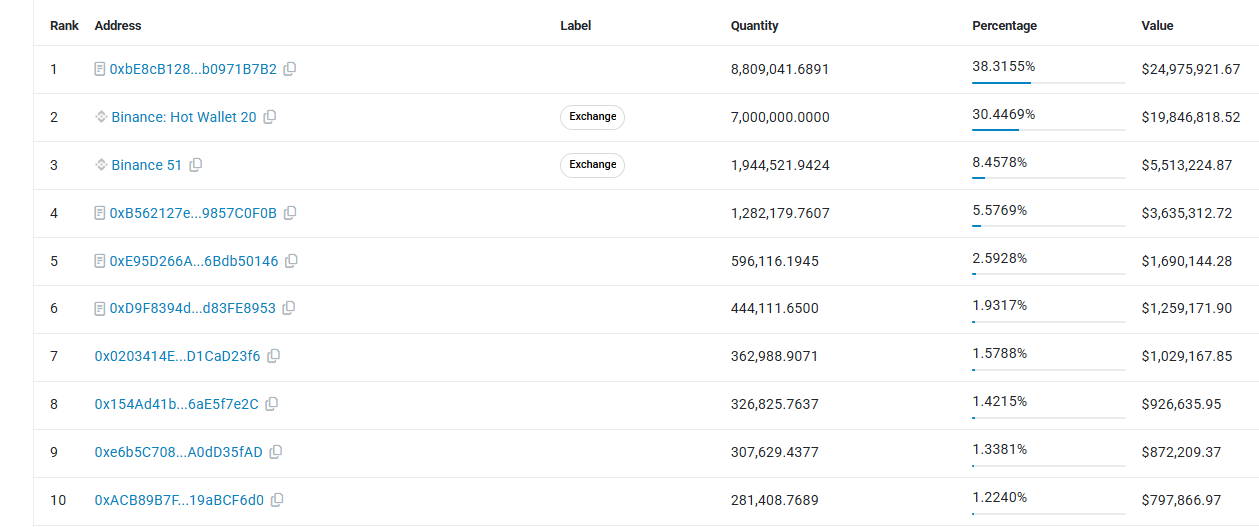 Looking at the top personal wallets, the largest non-exchange wallet holds 38.32% of the supply, worth approximately $24.98M; Binance's own hot wallet holds another 38.9% combined through two addresses. Full wallet-level details can be viewed on DEXE's BscScan holders page.
This concentration does not automatically mean a sell-off is imminent, but it is a structural risk factor that could increase volatility on both sides of the current wedge and deserves to be considered in conjunction with the level of technical analysis.
$DEXE Technical Analysis: Falling wedge breakthrough pattern
$DEXE is currently trading within a falling wedge on the 1-hour chart, which has continued to compress since recent highs. 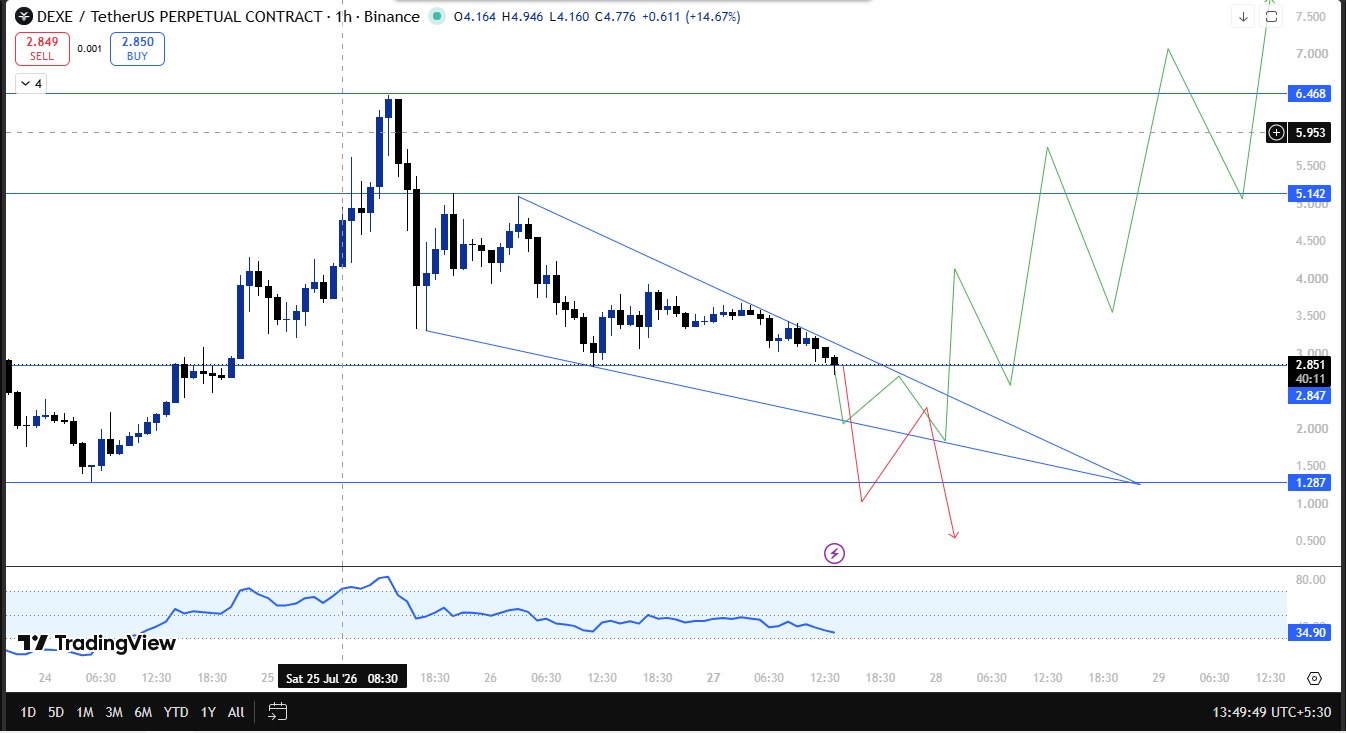 Price movements are limited between two convergent trend lines, and as the market develops, the wedge shape has narrowed significantly. If $DEXE breaks through the wedge and the closing price continues to stand above the wedge supported by strong trading volume, a breakthrough scenario will be confirmed, opening an upward path for subsequent resistance areas of $5.142 and $6.468. Volume conditions are critical here, because breakthroughs lacking actual volume are more likely to fail and fall back into the wedge shape.
On the downside, if DEXE falls below the wedge, the next support area to pay attention to is $1.287. Given the existing long-led clearing model, the break here may be accelerated as more long positions are forced to close, consistent with the scenarios mentioned in previous analysis.
The RSI on the hourly chart has cooled to the mid-1930s after experiencing overbought in the early period, which is consistent with the market's weakening momentum during the decline rather than accelerating into a new round of selling, but has not yet seen a meaningful recovery.
$DEXE Key Trading Terms
Downward wedge: A chart pattern formed by two downwardly sloping convergent trend lines is usually considered a persistent or reversing pattern, depending on the direction of the price breakthrough.
Clearing: occurs when a leveraged trade is forced to close due to insufficient margin from the trader.
Open interest: The total value of open derivative contracts, used to measure the degree of leverage activity in the market.
Gini distribution score: A measure of the uneven distribution of token supply among different holders, with a score close to 1 indicating extreme concentration.
Whale concentration: The proportion of the total token supply held in the largest wallet, used to measure the influence of a few holders on price.
RSI (Relative Strength Index): A momentum indicator that measures the speed and magnitude of price changes, often used to mark overbought or oversold conditions.
$DEXE Technical Snapshot Table
Indicator: Trend
Signal: Compression within a declining wedge, prices are still limited between trend lines
Indicator: Structure
Signal: Trading around $2.851, well above the wedge closing break trigger point
Indicator: RSI
Signal: Cooling to the mid-1930s, downward momentum weakens but no reversal is confirmed
Indicator: Clearing
Signal: Long clearing has been dominated by all time windows in the past 24 hours.
Indicator: Key trigger point
Signal: Continued closing above the wedge with a confirmed breakthrough in trading volume; the wedge fell below the target of $1.287
Indicator: Broad risk
Signal: Extreme holder concentration, whale wallets control more than 99% of market value
$DEXE Support and resistance levels to focus on
Type: Resistance 2
Level: $6.468
Remarks: Extended Upward Target
Type: Resistance 1
Level: $5.142
Notes: Confirm the next obstacle after breakthrough
Type: Break through trigger point
Level: $3.924 (wedge)
Notes: Continued closing required with strong trading volume
Type: Current price
Level: $2.849
Notes: Trading within a declining wedge
Type: Support area
Level: $1.287
Notes: Target if $DEXE falls below the wedge
DEXE trader's risk-reward table
Scenario: Bullish case
Trigger condition: Continued close above the wedge with accompanying trading volume
Target: Push to $5.142, then $6.468
Scenario: Bear case
Trigger: Break below the declining wedge
target: Sliding towards the $1.287 support area
Failure level for this $DEXE configuration
The bullish decline wedge scenario for $DEXE depends on whether it can continue to close above $3.924 supported by real trading volume, rather than just a brief shadow piercing. If the trigger point is not held, or the wedge structure breaks directly, the focus will shift to the $1.287 support area, especially since the bulls have already borne most of the recent liquidation. Conversely, a confirmed wedge breakout supported by trading volume will open the way to $5.142 and $6.468.
Expert views on the $DeXe price forecast
Traders following this $DeXe price forecast point out that the downward wedge structure coupled with a clearing model that is heavily biased towards bulls, It shows that the market has been repeatedly punishing early bottom-hunters, rather than truly panicking to fall to new lows. Extreme holder concentration increases risk beyond the chart itself, as a few whale wallets and exchange addresses control the vast majority of supply. Whether DEXE will eventually break through the wedge upwards or downwards will likely depend on which side attracts real trading volume first.
Disclaimer : This technical analysis is for educational purposes only and should not be regarded as financial or investment advice. The cryptocurrency market is extremely volatile.






















