
 Exchange Ranking
 Top Exchanges
 24h Volume Ranking
 Popularity Ranking
 Exchange BTC Balance
 Proof of Reserves
 Decentralized Exchanges
 Funding Rate
 Funding Heatmap
 Liquidation Data
 Max Pain
 Long/Short Ratio
 Whale L/S Ratio
 Binance/Okex/Huobi L/S
 Bitfinex Margin L/S
 ETF Tracker
 Solana ETF
 XRP ETF
 Hong Kong ETF
 Bitcoin Treasuries
 Crypto Reversal
 Ethereum Reserves
 HyperLiquid Wallet Analysis
 Hyperliquid Whale Watch
 Large Transactions
 On-chain Movement
 Bitcoin ROI
 Stablecoin Market Cap
 Options Analysis
 News
News Articles
 Economic Calendar
 Features
 Wallet
 Contract Calculator


 Security
 Collections
 Watchlist
 Following
 SOL
SOL As one of the most watched projects in the cryptocurrency market, Solana has recently continued to attract attention not only based on its price performance, but also through its growing ecosystem. The growth in the number of Internet users, the development of DeFi applications and the recovery of the memecoin ecosystem are key factors in increasing Solana's attention. In addition, increased interest among institutional investors in Solana-related products and rising expectations for spot ETFs also provide support for the long-term outlook.
The most important factor in determining Solana's performance in the future will be the sustainable growth of online activities. The choice of the Solana ecosystem for new projects, the expansion of stablecoin trading volume and the increase in the number of developers are core factors supporting investor confidence. With cryptocurrency market risk appetite remaining high, Solana is expected to continue to stand out among strong projects. However, potential weakness in the overall market environment and slowing ecosystem growth could put pressure on prices in the short term. Despite this, Solana is still a long-term project worthy of close attention due to technological progress and expanding application scenarios.
Technical analysis:
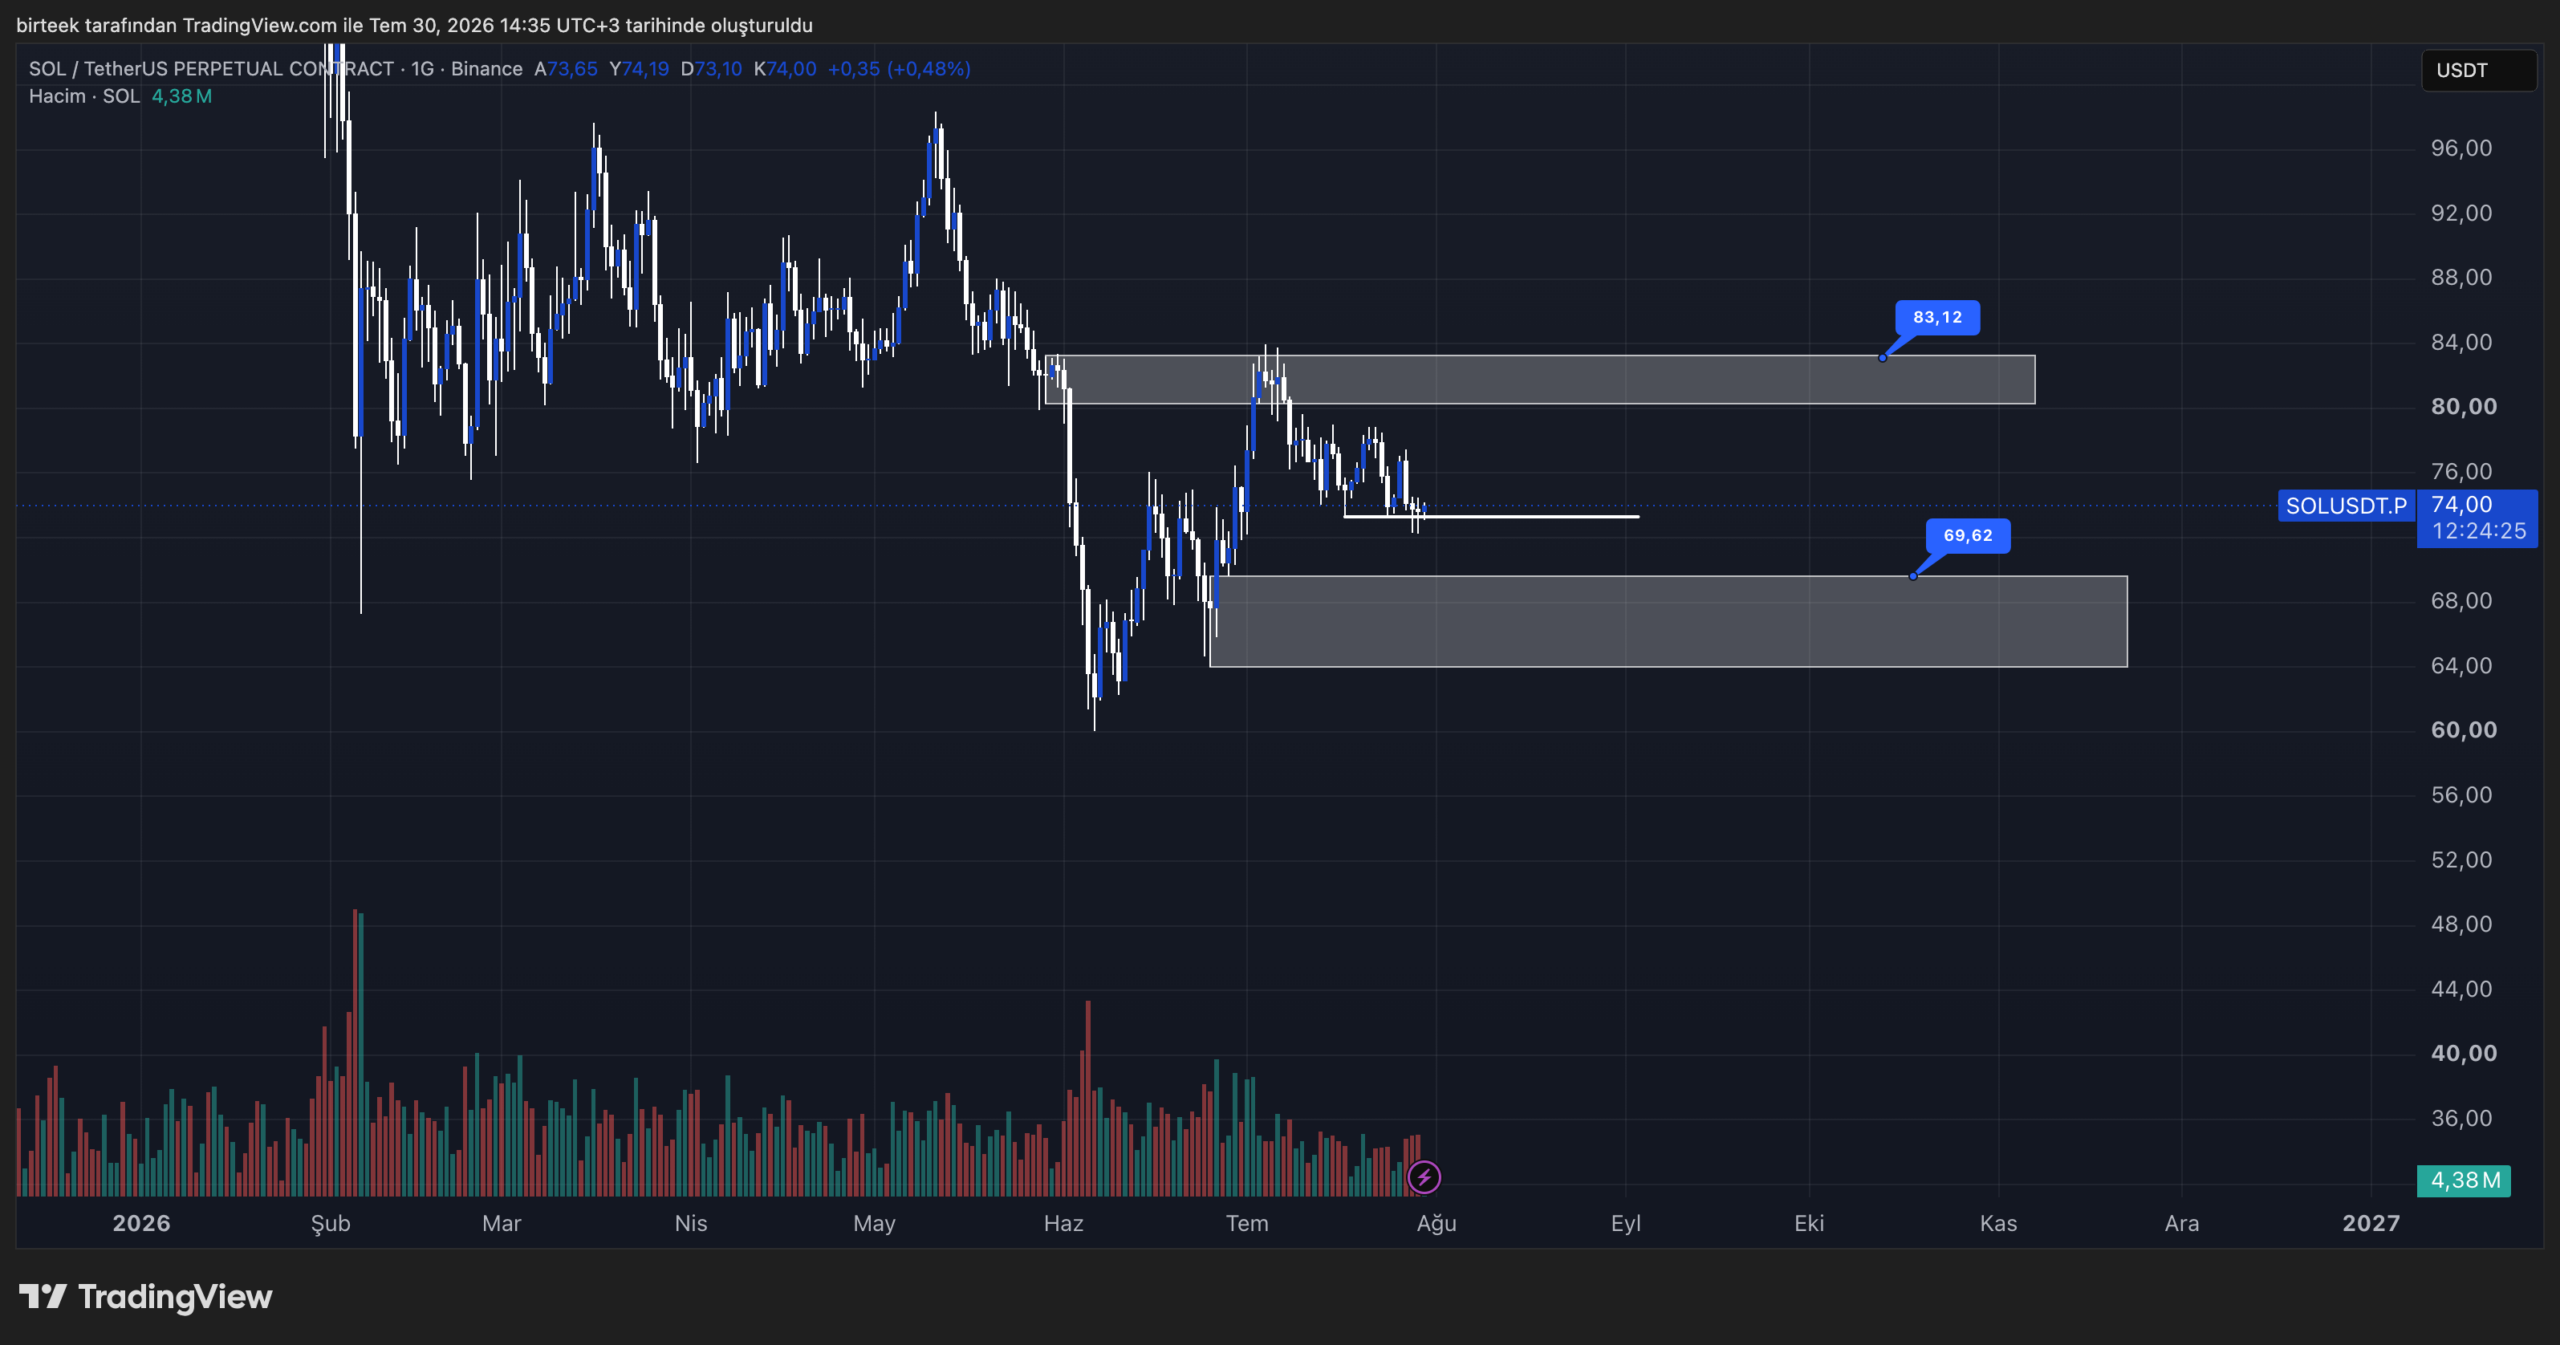 The daily chart of SOL/USDT shows that after the price was rejected in the US$83 region, the internal structure continued its downward trend, but no new lows have been formed on the daily chart. The holding of the current support area temporarily provides a positive signal. Failure to hit a new low is an important detail, increasing the possibility of prices challenging new highs. However, for this scenario to hold true, you need to see a reversal signal first.
Focus first on the US$77.60 level. A daily close above the region will constitute the first strong reversal signal. After the breakthrough, the first goal is $83. If the US$83 area is exceeded by heavy volume, the daily chart may turn into an upward trend again and the buyer's power is expected to increase. Therefore, these two levels will be crucial for price direction in the future.
If the current support area falls and the daily chart forms a new low, the main support level is US$69.60. This region is not only the starting point for the upward trend of internal structure, but also a key support area for previous breakthroughs. Therefore, in the correction, there is a high probability that prices will rebound from this region.






















