
 Exchange Ranking
 Top Exchanges
 24h Volume Ranking
 Popularity Ranking
 Exchange BTC Balance
 Proof of Reserves
 Decentralized Exchanges
 Funding Rate
 Funding Heatmap
 Liquidation Data
 Max Pain
 Long/Short Ratio
 Whale L/S Ratio
 Binance/Okex/Huobi L/S
 Bitfinex Margin L/S
 ETF Tracker
 Solana ETF
 XRP ETF
 Hong Kong ETF
 Bitcoin Treasuries
 Crypto Reversal
 Ethereum Reserves
 HyperLiquid Wallet Analysis
 Hyperliquid Whale Watch
 Large Transactions
 On-chain Movement
 Bitcoin ROI
 Stablecoin Market Cap
 Options Analysis
 News
News Articles
 Economic Calendar
 Features
 Wallet
 Contract Calculator


 Security
 Collections
 Watchlist
 Following
 SHIB
SHIB Shiba Inu is about to enter August, and traders are focusing on a cliché question: Is this the beginning of a real recovery, or is it another brief rebound? The current trading price of SHIB is US$0.0000462, which previously hit a high of US$0.0000472, with a trading volume of 617.7 billion units. The market is closely watching whether this support level can be held in early August.
Shibburn reported that 2.96 billion SHIBs were destroyed last week, the largest weekly destruction in nearly a year. ETF qualification discussions and United Arab Emirates's Crypto.com Pay integration also allow SHIB to continue to attract the attention of traders. In addition, the price momentum of SHIB has also increased.
ETF topics bring a new narrative to SHIB
Recent market excitement mainly stems from speculation about ETFs. SHIBMoral claims companies such as BlackRock and Fidelity may eventually launch SHIB ETFs. Although it has not yet been officially registered, this rumor has attracted widespread attention because SHIB is listed as a T. Eligible assets in the Rowe Price active crypto ETF filing.
This is an important difference. Qualified assets are not equivalent to guaranteed investments. T. Rowe Price's products are proactively managed, so its configuration of SHIB may be adjusted at any time.
Even so, the discussion itself is significant. A few years ago, SHIB was discussed almost entirely as a meme coin. Today, it appears at least in institutional crypto products, which has changed the way some investors view the token.
United Arab Emirates adds real-life payment scenarios
Another development that has attracted traders to pay attention to SHIB comes from United Arab Emirates, which announced that eligible United Arab Emirates residents can use Crypto.com Pay to book flights through the airline's website and app.
SHIB has been included in Crypto.com Pay's support and can therefore be used for eligible bookings through the payment system. The Shib team quickly pointed out the connection, and the reaction was reasonable.
This does not guarantee mass adoption, but it does expose SHIB to a real-world payment scenario related to major airlines around the world. This differs from a purely speculative narrative and is in line with broader efforts to expand the practicality of the SHIB ecosystem.
SHIB chart's forecast for August
I analyzed the SHIB chart, and the first test was very clear. The SHIB price needs to exceed the levels of US$0.0000472, US$0.0000500 and US$0.0000513. The latter is the 100-day moving average. If the daily closing price can stand above this moving average, it will be the strongest technical signal the bulls have seen in the near future. 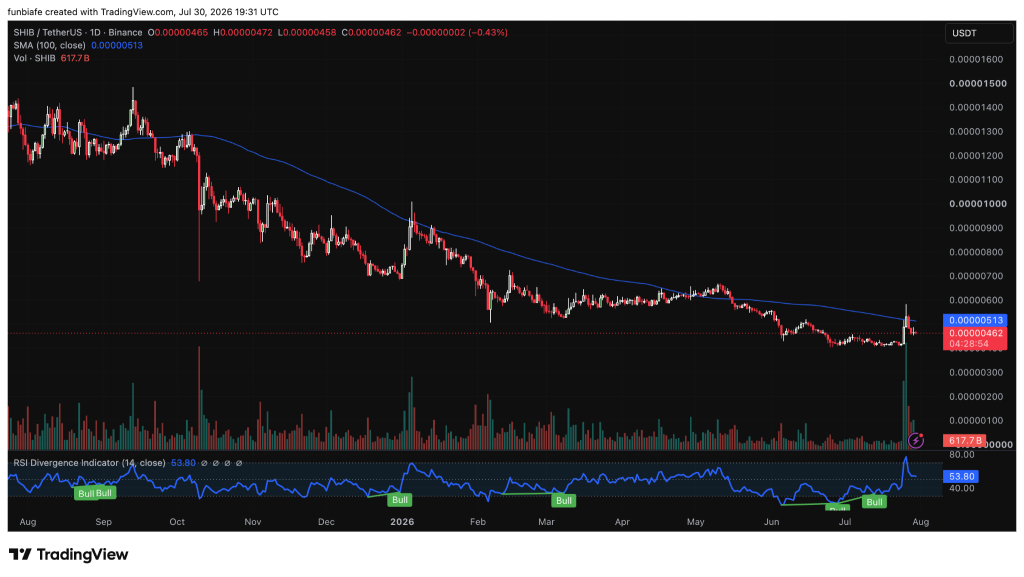 Source:TradingView
On the downside, US$0.0000458, US$0.0000450 and US$0.0000400 are the main support levels for SHIB. After falling below these levels,$0.0000350 will become important. The trend in August seems relatively clear: if it breaks through $0.0000513, it is expected to rise further into the $0.0000600 to $0.0000700 range. If a breakthrough cannot be achieved, it means that the larger downward trend is still intact.
The visibility of ETFs and the payment integration of United Arab Emirates are both constructive developments. The chart also shows early signs that selling pressure is easing. The missing link is the confirmation of a breakthrough of the 100-day moving average, which is the level that most traders will focus on when August starts.
Frequently Asked Questions
Is SHIB related to ETF filing? SHIB is listed as T. The qualifying assets in the Rowe Price active crypto ETF filing have sparked speculation about future institutional exposure.
What factors may drive SHIB prices in August? Traders are focusing on destruction rates, ecosystem updates, ETF-related developments, and whether SHIB prices can break through the resistance zone of $0.0000513.






















