
 Exchange Ranking
 Top Exchanges
 24h Volume Ranking
 Popularity Ranking
 Exchange BTC Balance
 Proof of Reserves
 Decentralized Exchanges
 Funding Rate
 Funding Heatmap
 Liquidation Data
 Max Pain
 Long/Short Ratio
 Whale L/S Ratio
 Binance/Okex/Huobi L/S
 Bitfinex Margin L/S
 ETF Tracker
 Solana ETF
 XRP ETF
 Hong Kong ETF
 Bitcoin Treasuries
 Crypto Reversal
 Ethereum Reserves
 HyperLiquid Wallet Analysis
 Hyperliquid Whale Watch
 Large Transactions
 On-chain Movement
 Bitcoin ROI
 Stablecoin Market Cap
 Options Analysis
 News
News Articles
 Economic Calendar
 Features
 Wallet
 Contract Calculator


 Security
 Collections
 Watchlist
 Following
 SHIB
SHIB Real-time $SHIB price data
Shiba Inu is currently priced at approximately US$0.0000485, down 0.4% in the past 24 hours, after rising sharply after soaring in the morning on July 25 and 26, and then cooling down. 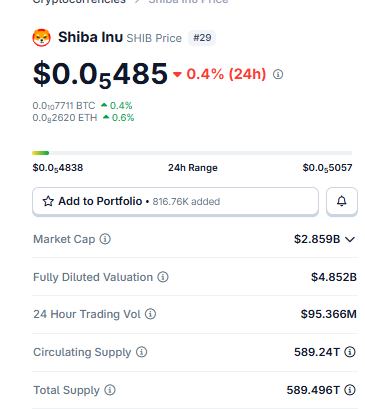 The current market value of the token is US$2.859 billion, the fully diluted valuation is US$4.852 billion, the circulation supply is 589.24 trillion pieces, and the total supply is 589.496 trillion pieces. Compared with most memes, the gap between circulation and total supply is relatively small. The 24-hour trading volume was US$95.366 million, indicating that the memo can still attract considerable liquidity despite the correction. This volume will determine whether the current trend line backtest turns into a real breakthrough or falls back into the previous range.
Exchange Volume and Clearing Snapshot
In terms of spot volume, Upbit leads with US$6.04 million, Binance closely follows with US$4.76 million, OKX, Bybit and Gate.io with US$2.22 million, US$2.18 million and US$1.53 million respectively. 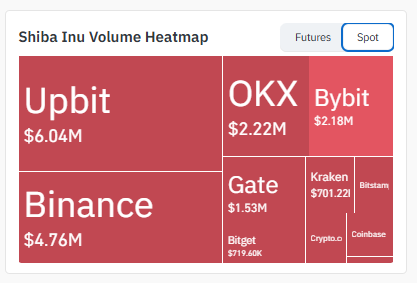 shows that liquidity is more evenly distributed among major trading platforms rather than concentrated on a single exchange. This distribution often makes sharp shadows driven by a single exchange less frequent. In terms of derivatives, the total 24-hour liquidation was US$176.06 million, of which US$136.43 million was cleared for long and US$39.63 million was cleared for short, indicating that leveraged buyers suffered greater losses during this correction.
 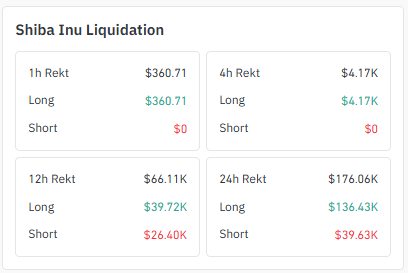 The shorter 4-hour and 1-hour windows show that liquidations are almost entirely concentrated in long positions, implying that late-stage buyers chasing recent surges are the first to be trapped when prices fall back and consolidate.
Today's Shiba Inu Coin News
Another report this week pointed out that the destruction rate of SHIBs has soared, with the token destruction rate increasing by more than 400%, and more than 124 million SHIBs were withdrawn from circulation within 24 hours. 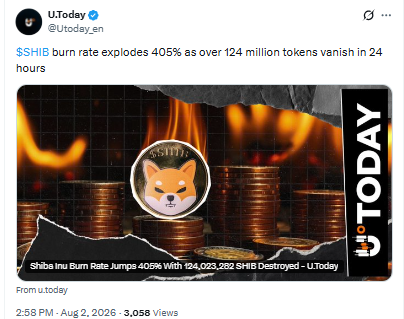 A surge in destruction of this magnitude is often seen by holders as a bullish signal because although the total supply remains as high as 589.496 trillion pieces, it reduces supply.
Analysts pointed out that when the surge in destruction rates occurs simultaneously with strong trading volume and prices, its significance is even more significant, which is closely related to whether the current trend line can be held back.
Key Points
SHIB traded at approximately US$0.00000485, down 0.4% in 24 hours, after a breakout of the downtrend line was backtested on the 4-hour chart.
If a breakthrough is confirmed, prices may move towards the resistance areas of US$0.0000540 and US$0.0000584.
If the backtest fails, SHIB may fall back to the support level of US$0.0000458 and fall towards orders near US$0.0000411 in a deeper correction.
The daily chart shows the same downtrend line structure, with the next resistance targets of US$0.0000587 and US$0.00000670 if bulls are in control.
The 24-hour liquidation amount was US$176.06 million, of which the bulls suffered most of the losses, US$136.43 million.
4-hour chart technical analysis
On the 4-hour chart,$SHIB took weeks to establish a demand area between $0.0000411 and $0.0000458, an order block that drove strong gains once volume increased. The price then fell back to a narrow consolidation range of approximately $0.0000458 to $0.0000486, and just broke through the downtrend line that suppressed the overall trend. 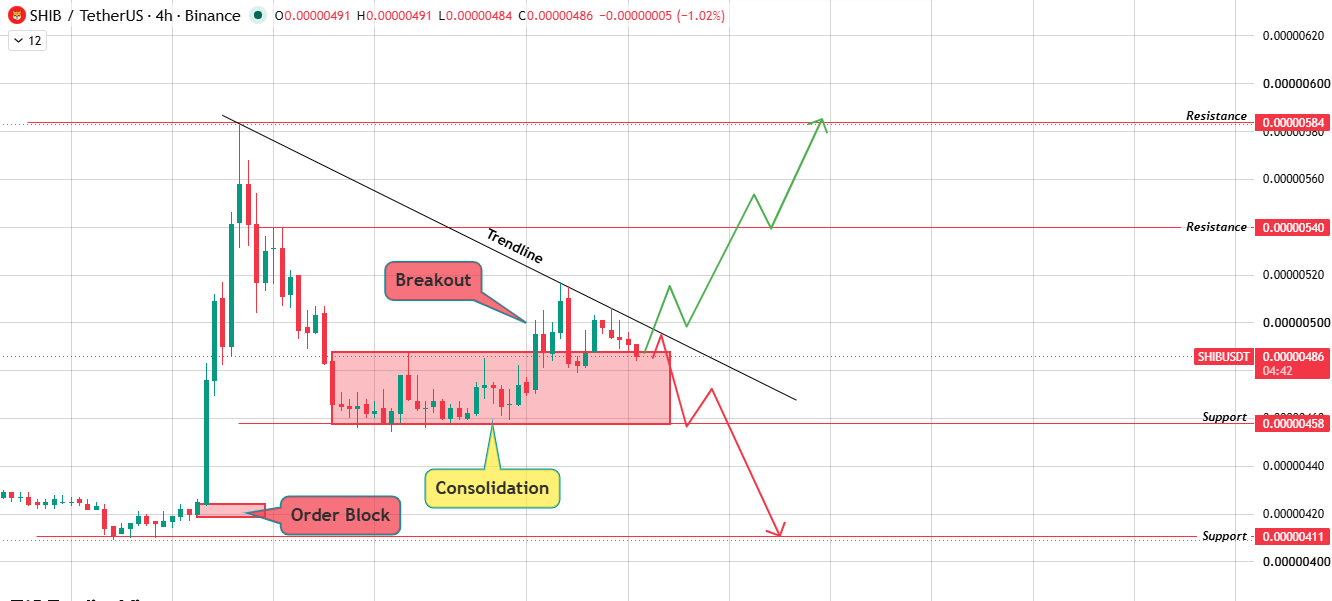 This Shiba Inu price forecast regards the current K-line as a backtest of the trend line rather than a confirmation of a breakthrough. If buying volume holds on to this backtest and breaks through the trend line, there is room for prices to climb to $0.0000540 and then to $0.0000584. If the backtest fails and the consolidation support falls,$SHIB risks falling back to US$0.0000458 and may fall further to the demand area of US$0.0000411. A rebound will then be the first signal for buyers to re-enter.
Technical Analysis of Daily Chart
The same downtrend line exists on the daily time frame, which has suppressed $SHIB since recent local highs. 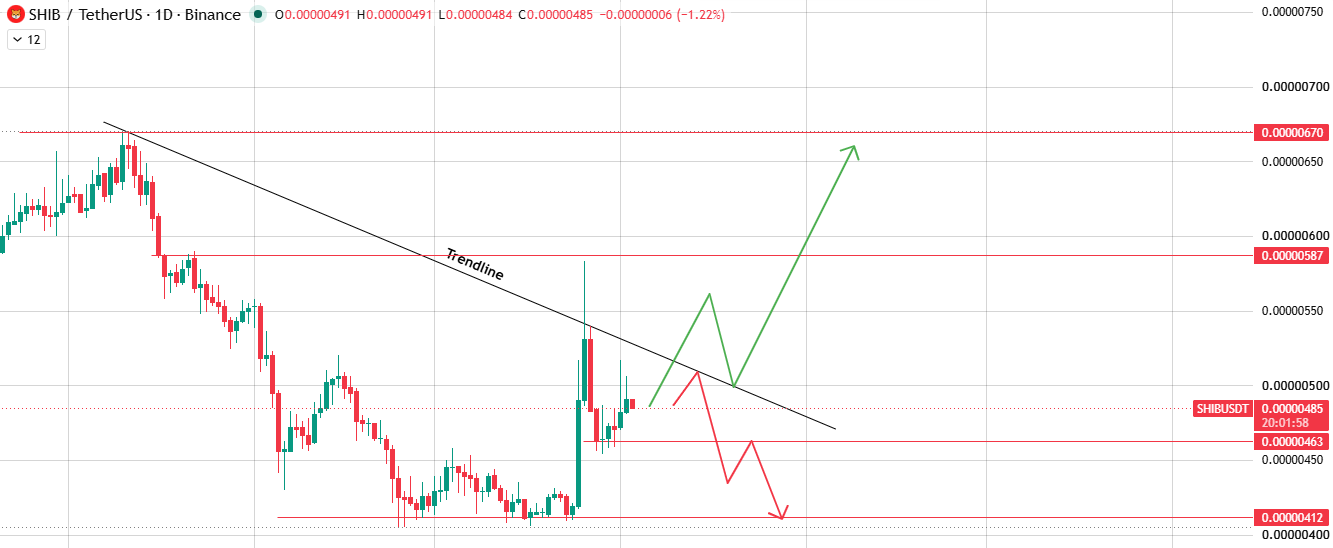 A breakthrough in the trend line supported by volume will open the way to US$0.0000587. If momentum continues further, US$0.0000670 will be the next major resistance level. If the breakthrough fails, prices are suppressed by the trend line, with the daily chart showing the first support level of $0.0000463, followed by a deeper decline target of $0.0000412. This structure makes the daily Shiba Inu price forecast closely related to the performance of prices near the trend line in the next few trading days.
Long vs Short Scenario
In a bullish scenario, a clean break in volume support and a backtest hold above the trend line will push the SHIB towards $0.0000540 on the 4-hour chart and extend to $0.0000587 and $0.00000670 on the higher time frame. In a bearish situation, the backtest failed, the consolidation support level of US$0.0000458 fell, and the price will slide towards US$0.0000411 to US$0.0000412. The previous order block will be used as the next demand area. This balanced framework leaves both outcomes on the table until the K-line close (rather than the intraday shadow) confirms which side is in control.
Methodology
This forecast is based on TradingView's technical analysis of 4-hour and daily charts, current market data, exchange volume distribution, and clearing data. Does not constitute financial advice.
Glossary
Order blocks
A price area where a large number of purchases or sales have occurred previously, usually serves as support or resistance in the future.
Trend line
A line connecting high or low prices to identify the direction and boundaries of a trend.
Consolidation
The period when prices trade in a narrow range before breaking through or breaking below.
Liquidation
When losses exceed available margin, leveraged positions are forcibly closed.
Resistance levels
Sell pressure on price areas that have historically hindered or reversed upward trends.
Disclaimer
This content is for reference only and should not be regarded as financial advice. The cryptocurrency market (including memes such as Shiba Inu) is extremely volatile and poses a significant risk of loss. Be sure to research and consult a licensed financial adviser before making an investment decision.






















