
 Exchange Ranking
 Top Exchanges
 24h Volume Ranking
 Popularity Ranking
 Exchange BTC Balance
 Proof of Reserves
 Decentralized Exchanges
 Funding Rate
 Funding Heatmap
 Liquidation Data
 Max Pain
 Long/Short Ratio
 Whale L/S Ratio
 Binance/Okex/Huobi L/S
 Bitfinex Margin L/S
 ETF Tracker
 Solana ETF
 XRP ETF
 Hong Kong ETF
 Bitcoin Treasuries
 Crypto Reversal
 Ethereum Reserves
 HyperLiquid Wallet Analysis
 Hyperliquid Whale Watch
 Large Transactions
 On-chain Movement
 Bitcoin ROI
 Stablecoin Market Cap
 Options Analysis
 News
News Articles
 Economic Calendar
 Features
 Wallet
 Contract Calculator


 Security
 Collections
 Watchlist
 Following
 M
M Where will the M token go?
The core of this price forecast for MemeCore tokens is to determine how the price will break through the current consolidation range. If the upper edge of the range can be broken through with the cooperation of real trading volume,$M is expected to hit the recent high or even higher position. Conversely, if the price breaks downward, the token is likely to give up a considerable portion of its recent gains before it can find support again. In any case, daily closures in the next few days will clearly point the way.
M token real-time price data
Currently, the trading price of MemeCore's token $M is approximately 1.16 US dollars , up 7.12% within the day, making it one of the stronger performers in this batch of tokens. Its market value is approximately US$1.55 billion , also up 7.25%, while the fully diluted valuation is as high as US$11.67 billion . This huge gap suggests that a large portion of the total supply of the token is still not yet in circulation. 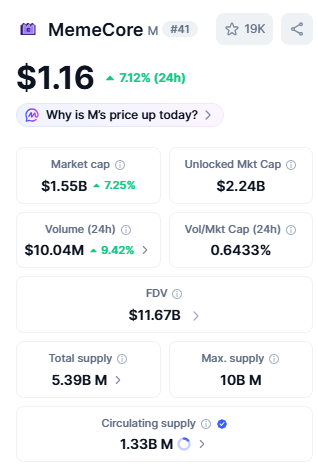
Among the total supply of 5.39 billion and the maximum supply of 10 billion, the current circulating supply is 1.33 billion. This means that there is still a large amount of unlocks waiting to be released in the future. The 24-hour trading volume was approximately US$10.04 million , up 9.42%, but the trading volume to market value ratio was only 0.6433%, indicating that the current trading activity is still low relative to its market value.
Overview of Exchange Volume and Open Positions Data
Trading volume was mainly contributed by BingX (US$6.67 million) and Binance (US$4.81 million), with Bybit, KuCoin and LBank forming the second tier, in addition to small amounts of traffic from platforms such as Gate, Bitunix and WhiteBIT. 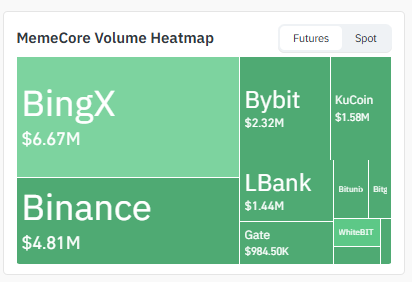
For a token with a market value of more than US$1.5 billion, this total transaction volume is small. This is worth noting, as low liquidity may make prices fluctuate more violently in either direction. As of now, the amount of open positions is still low, with the total open position amount in 24 hours being only US$7580 , of which US$2000 have been opened for long positions and US$5580 have been opened for short positions. 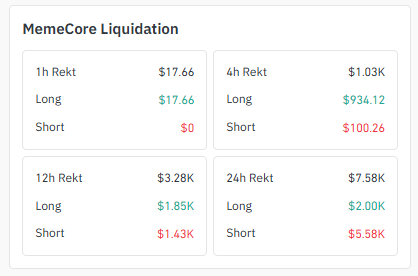
From the 4-hour level, long positions accounted for a larger share, reaching US$934.12, while short positions accounted for only US$100.26, which indicates that the recent rise in tokens may have squeezed out some of the belated short positions.
Core Points
MemeCore's M token rose 7.12% today and is currently trading at close to US$1.16 after experiencing strong gains over the past few trading days.
Prices are currently consolidating within a symmetrical triangle at the daily level. If the upper boundary can be broken through with the cooperation of trading volume, US$1.4803 will become the target, followed by a more important target of US$1.8325 .
What if you break down? $M may face the risk of falling to US$0.7363 , with deeper support at US$0.4545 .
On the 4-hour chart,$MRunning in an ascending channel. If the upper boundary is breached, US$1.5014 will come into view, followed by US$1.6716 .
If it breaks below the lower boundary of the channel, then US$1.0109 is the first line of defense, followed by US$0.8558 .
Technical Analysis of 4-hour charts
Focusing on the 4-hour chart,$M has been climbing in the rising channel . After experiencing a rapid rise earlier in the session, the price is currently around US$1.1674 . 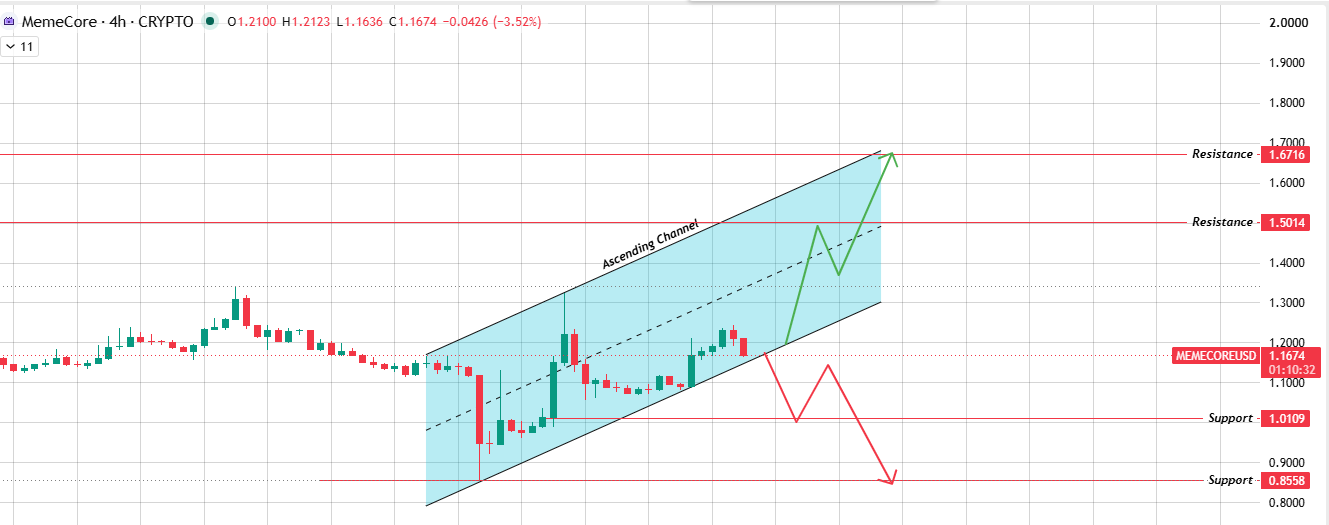
If it can break through the upper boundary of the channel driven by trading volume, US$1.5014 is the first price to pay attention to and may later challenge US$1.6716 . On the contrary, if the lower boundary falls below, the first target is US$1.0109 . If selling pressure continues to strengthen, it may fall further to US$0.8558 . This short-term channel is basically the core driving force behind the rise of $M in the past few trading days. It is worth paying attention to whether this driving force can continue to operate or whether it needs to be rested first.
Technical analysis of daily charts
On the daily chart,$M has been consolidating within the symmetric triangle for several weeks, and the price is currently near the apex of the triangle. Approximately US$1.1657 . 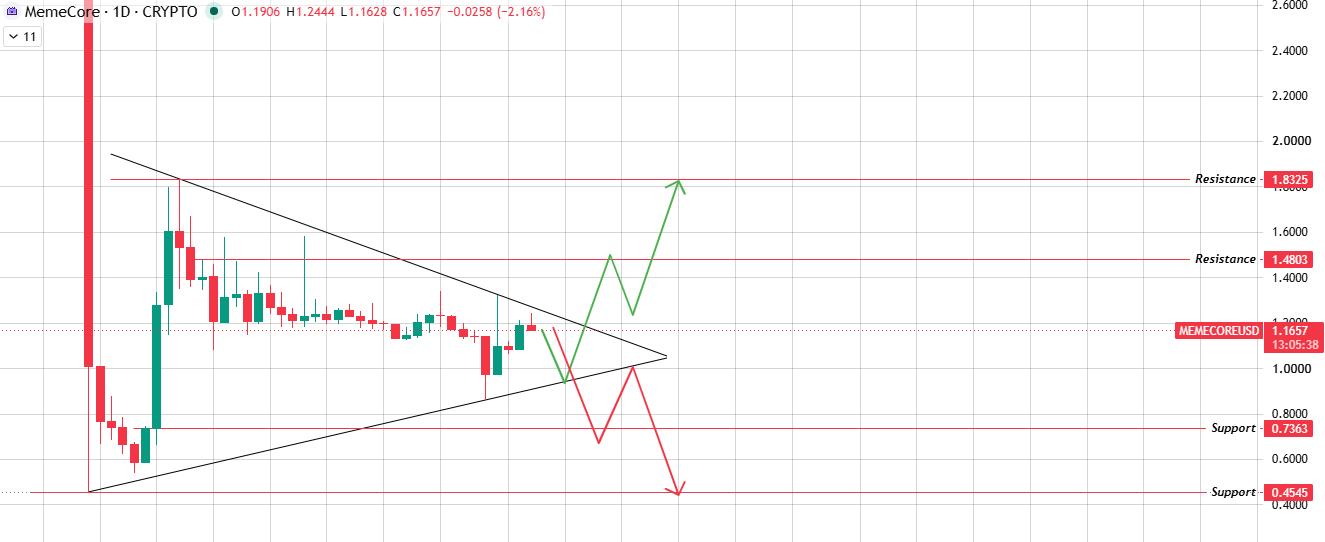
The details are as follows: If the price breaks through the upper boundary of the symmetrical triangle with the cooperation of volume, the upward channel will open and the target points to US$1.4803 ; if the bull power further strengthens, the more important target is US$1.8325 . However, if the symmetrical triangle chooses to break downward, that is, the short power breaks through the lower boundary, the chart shows that the next support level is at US$0.7363 ; if the decline continues, the deeper support level is at US$0.4545 . A symmetrical triangle like this often causes violent fluctuations once the price finally chooses the direction. Therefore, this apex area is a key position worthy of close attention in the next few trading days.
Long vs Short Scenario Analysis
What do bulls need? It is necessary for prices to break through the upper boundary of the 4-hour channel, move towards US$1.5014 and US$1.6716 , and then drive the daily symmetrical triangle to break through upward, opening up the space of US$1.4803 and finally rushing to US$1.8325 . This trend requires a significant increase in volume from current levels, rather than just a moderate increase in prices. Bears want the opposite scenario: The lower boundary of the channel was broken, and the daily symmetrical triangle broke downward. The M token fell towards US$1.0109 and US$0.8558 within a short time frame. Deeper daily targets are $0.7363 and $0.4545 。This price forecast retains possibilities in both directions until the price is finally confirmed to break through the symmetrical triangle, so it is more prudent to wait for the confirmation signal than to chase the rise and kill the fall.
Methodology
This analysis is based on TradingView technical analysis of 4-hour and daily charts, and combines current market data, exchange volume and open position data. Nothing constitutes financial advice.
Glossary
Upward channel : Two upwardly sloping parallel lines that limit price fluctuations to an upward trajectory.
Symmetric triangle : The high point gradually decreases, the low point gradually increases, and the price fluctuation range continues to narrow until the breakthrough direction is finally chosen.
Support area : A position where buying has appeared in history. It is worth watching whether prices will rebound here again.
Resistance level : The position where selling has occurred in history. It is worth paying attention to whether prices stagnate or reverse here.
Open position : When a leveraged trading loss consumes the margin, it is forced to close a position.
Disclaimer
This MemeCore price forecast is based on technical analysis and current market conditions. The cryptocurrency market is highly volatile and prices can move very quickly. The content of this article is for reference only and does not constitute financial or investment advice. Be sure to conduct independent research before making any investment decisions.






















