
 Exchange Ranking
 Top Exchanges
 24h Volume Ranking
 Popularity Ranking
 Exchange BTC Balance
 Proof of Reserves
 Decentralized Exchanges
 Funding Rate
 Funding Heatmap
 Liquidation Data
 Max Pain
 Long/Short Ratio
 Whale L/S Ratio
 Binance/Okex/Huobi L/S
 Bitfinex Margin L/S
 ETF Tracker
 Solana ETF
 XRP ETF
 Hong Kong ETF
 Bitcoin Treasuries
 Crypto Reversal
 Ethereum Reserves
 HyperLiquid Wallet Analysis
 Hyperliquid Whale Watch
 Large Transactions
 On-chain Movement
 Bitcoin ROI
 Stablecoin Market Cap
 Options Analysis
 News
News Articles
 Economic Calendar
 Features
 Wallet
 Contract Calculator


 Security
 Collections
 Watchlist
 Following
 BONK
BONK  BTC
BTC  ETH
ETH BONK landed in late 2022 as Solana's response to the memecoin craze sweeping other ecosystems. BONK was airdropped to the community just as the Solana chain was recovering from its trough. To be honest, its effect exceeded everyone's expectations. Solana needed a spark, and BONK became one of the loudest voices.
Fast forward to now, this issue's Bonk price forecast will focus on the actual status of BONK-the current trading price is approximately US$0.0000280-and explore whether the current market landscape is more favorable to buyers or sellers.
Bonk Price Forecast: Real-time market data
BONK The current trading price is US$0.0000280, a 24-hour decline of 0.8%. The market value is approximately US$246.508 million. Since BONK's entire supply of 87.995 trillion pieces is already in circulation, its fully diluted valuation is the same as the market value.
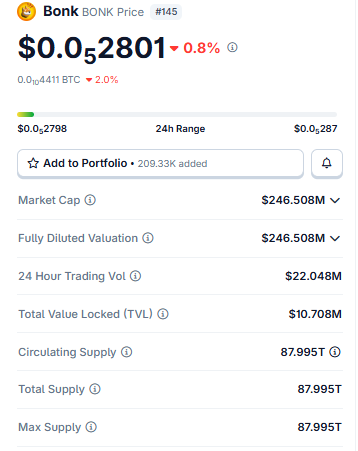
There is no need to worry about possible future dilution issues. Daily trading volume of $22.048 million maintains market activity, while the total lock-in value is close to $10.708 million, indicating that in addition to pure speculation, there is also real ecological activity.
On-chain and market drivers
BONK's liquidation heat map is currently almost silent. Looking at all time frames-the 1-hour, 4-hour, 12-hour and 24-hour windows-shows the exact same clearing amount of $22.58, all from long positions, with short positions untouched.
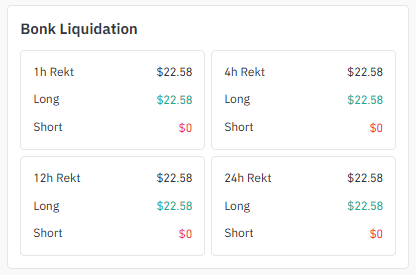
This repetitive flat data across time windows means that a small long position was cleared not long ago and the market has not changed since then. There is no chain reaction, no short squeeze, just a calm market waiting for the next real move.
In terms of exchange trading volume, OKX leads with US$3.34 million, far exceeding other platforms. Bitunix followed with $1.03 million, followed by LBank ($875.21 million), WhiteBIT ($544.13 million) and Gate.io ($462.64 million).
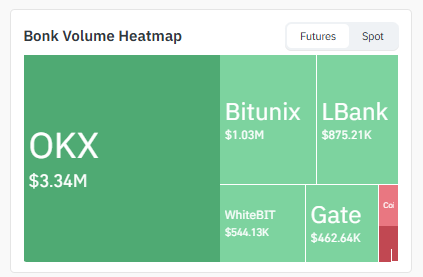
This dispersion among multiple exchanges suggests relatively healthy liquidity, although trading volume is concentrated in OKX, which means that large fluctuations on the platform may ripple across the market.
Key Points
BONK is trading at US$0.0000280, trapped in a downtrend channel on the 4-hour chart. If the price breaks through the channel with volume, it may move towards US$0.0000309. On the daily chart, the demand area near $0.0000270 has absorbed selling pressure for several consecutive weeks. If this demand area falls, BONK risks falling to the 1.618 Fibonacci extension level of US$0.0000223. Liquidation activity was almost zero, totaling only $22.58, and all came from long positions.
$BONK Technical Analysis
4-hour chart analysis
On the 4-hour chart, BONK is framed in a clear downward channel that has been oscillating back and forth between a downward upper rail and a downward lower rail for weeks.
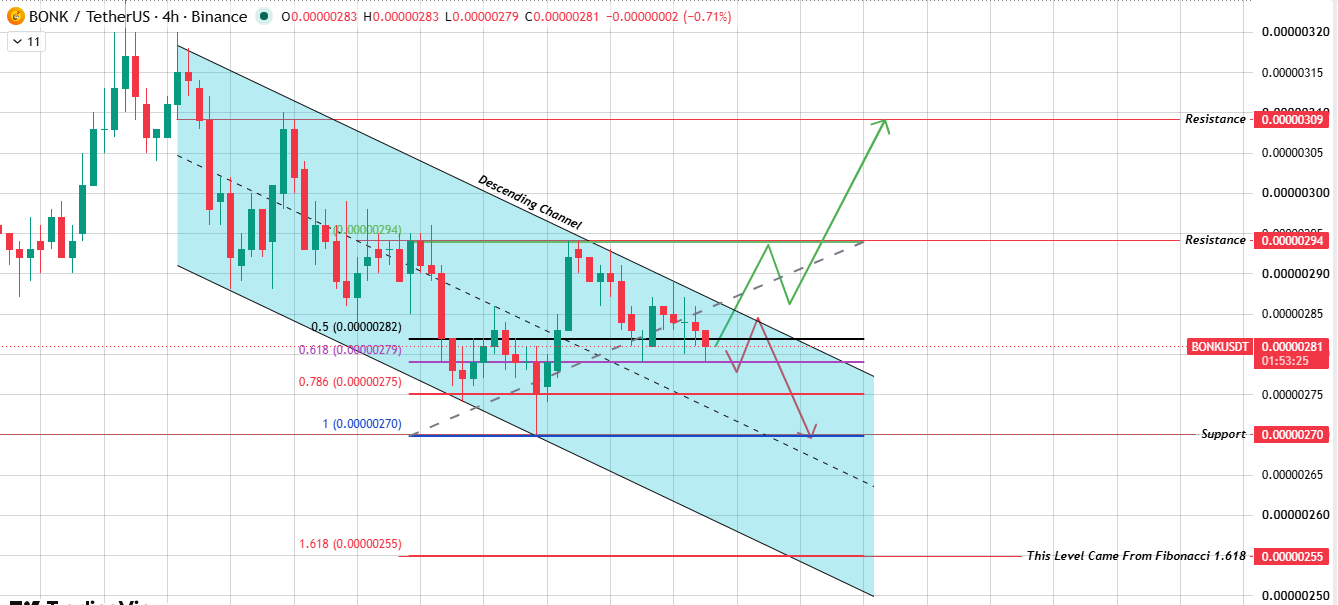
If the price breaks through the upper track with trading volume, it is expected to first move towards the resistance level of US$0.0000294. If momentum continues, it is expected to hit US$0.0000309. However, if $BONK cannot hold above the upper track, it is expected to fall back to the lower track and may break further, opening the path to the US$0.0000270 support level. The next target further down is the Fibonacci 1.618 extension of US$0.0000255.
Daily chart analysis
zooms in the time frame to the daily chart, with a downtrend line suppressing every rebound, while there is a wide demand area below the price, roughly between US$0.00000270 and current price levels.
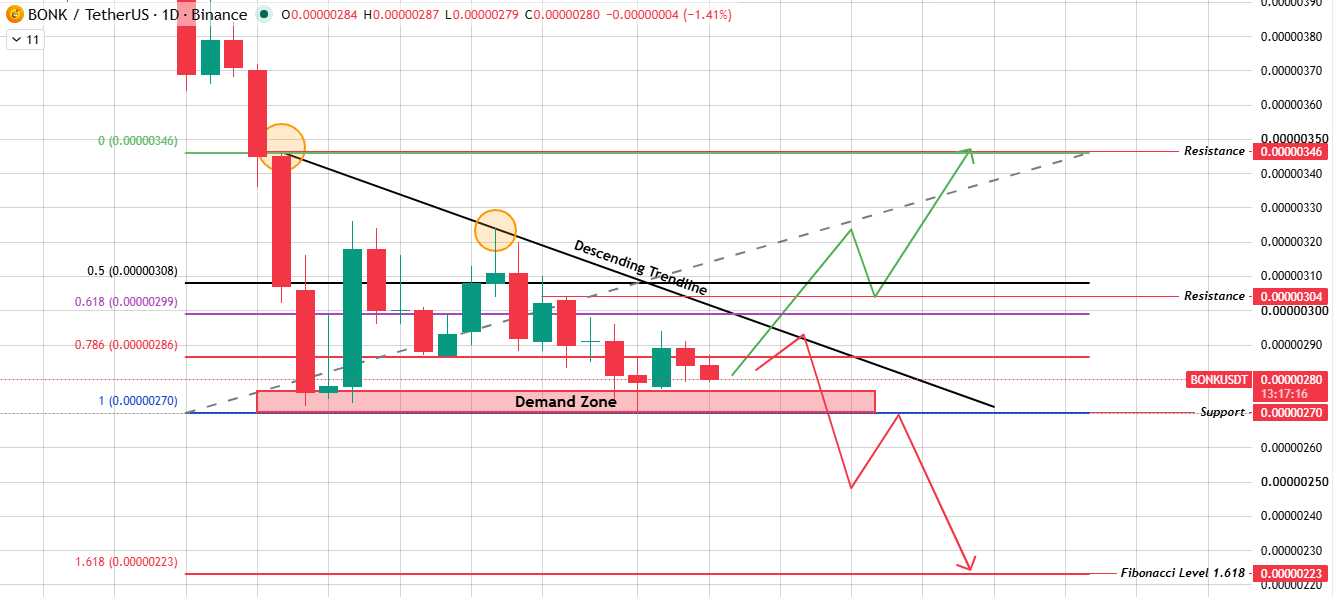
This area has absorbed selling pressure for some time. If prices can rise above the demand zone with volume and break through the trend line,$BONK is likely to move towards the resistance level of $0.0000304, with a further expansion target of $0.0000346. On the contrary, if the demand area fails to hold, the bears will break it down, and the decline may extend all the way to the Fibonacci 1.618 expansion level near $0.0000223.
Bullish, neutral and bearish scenarios
Bullish scenarios: Trigger conditions: rebound from demand areas, accompanied by strong trading volume breaking through the downtrend line. Target price: $0.0000304, extended to $0.0000346.
Neutral scenario: Trigger condition: Prices fluctuate between the demand area and trend line resistance. Target price range: 0.0000270 - 0.0000304 US $.
Bear scenario: Triggering conditions: The demand area cannot be held and selling pressure intensifies. Target price: $0.0000223.
What can disrupt a bullish scenario? Prices are again stuck at the downtrend line. What undermines a bearish scenario? Buyers re-enter the demand area with substantial buying orders.
The catalyst to pay attention to
Whether the demand area is held or lost is the real story behind the current Bonk price forecast. The impact of Solana ecosystem activity on BONK is often more important than most catalysts, as the token's fate remains closely linked to activity and market sentiment across the network. In addition, BONK's price target often moves with changes in BTC dominance; a decline in the dominance chart usually gives more room to the meme coin on Solana. Given that BONK exists entirely on the Solana chain, the relevance of ETH will have less impact here, but broader crypto risk appetite will still set the overall tone. Pay close attention to changes in transaction volume at the boundaries of price testing channels or demand areas.
Analyst Forecast
Most of the current discussion about BONK focuses on whether the demand area can be held, rather than a single bullish or bearish view from a specific analyst. The area has absorbed multiple sell attempts without being broken down, which is currently technically beneficial to buyers, but it has not yet passed the test of large volume. Calm liquidation data adds another meaning to the picture. Given that there have been few forced liquidations in either direction recently, no matter what trend occurs next, it is more likely to reflect real position adjustments rather than leverage being washed out by the market.
Long-term outlook
Looking at the long term,$BONK remains well below its early cyclical highs, and its long-term path remains closely linked to Solana's overall health as a chain. This is both an opportunity and a risk. Solana's strong activity tends to drive $BONK up, but weakness in the chain can also drag on BONK, regardless of its own technical aspects. The demand area is continued to be held, coupled with the breakthrough of the daily downtrend line, which will be the clearest long-term bullish signal at present. Before this happens, BONK's trading price may reflect more Solana's overall sentiment than its own unique value.
Glossary
Downward channel: Both parallel lines slope downward, framing prices between the upper and lower rails of descent until prices break through in either direction.
Downtrend Line: A downward sloping line connecting a series of successively decreasing highs, which is either suppressed by prices or eventually breaks through.
Demand Area: A price range in which buyers have intervened repeatedly to absorb selling pressure and support price recovery.
Support/Resistance: Chart areas where buying or selling have appeared with sufficient force in the past to suspend or reverse price movements.
BTC dominance: Bitcoin's share of the total market value of cryptocurrencies is a quick indicator of whether altcoins and memecoins have room to rise.
Methodology: Price levels are directly derived from TradingView charts on the 4-hour and 1-day lines; clearing and volume data are derived from Coinglass; no inferences are made about data outside the visible chart structure.






















