
 Exchange Ranking
 Top Exchanges
 24h Volume Ranking
 Popularity Ranking
 Exchange BTC Balance
 Proof of Reserves
 Decentralized Exchanges
 Funding Rate
 Funding Heatmap
 Liquidation Data
 Max Pain
 Long/Short Ratio
 Whale L/S Ratio
 Binance/Okex/Huobi L/S
 Bitfinex Margin L/S
 ETF Tracker
 Solana ETF
 XRP ETF
 Hong Kong ETF
 Bitcoin Treasuries
 Crypto Reversal
 Ethereum Reserves
 HyperLiquid Wallet Analysis
 Hyperliquid Whale Watch
 Large Transactions
 On-chain Movement
 Bitcoin ROI
 Stablecoin Market Cap
 Options Analysis
 News
News Articles
 Economic Calendar
 Features
 Wallet
 Contract Calculator


 Security
 Collections
 Watchlist
 Following
ANSEM, also known as the "Black Ox", is a memin project built around cryptocurrency analyst and commentator Ansem, trading on multiple major exchanges, including KuCoin. Black Ox is the main body behind the ANSEM project. This Black Ox Price Forecast will explore whether this trend can continue in the next one to two weeks after it recently breaks through the upward trend line. As long as the price remains above $0.1780, the bullish logic remains true; a break below that level will once again call into question the effectiveness of a breakthrough. The following is what the chart and derivative data show.
Black Ox Price Forecast Today's Market Overview
Indicators| Value
Price| US$0.1858
Market Value| US$77.18 Million
Fully Diluted Valuation| US$185 million
24-hour trading volume| US$12.86 million
Volume/Market Value (24 hours)| 16.81%
Liquidity/Market Value| 5.90%
Total Supply| 999.93 million ANSEM
maximum supply| $billion ANSEM
Circulation Supply| 417.14 million + $ANSEM
holders| 135,430
$ANSEM Snapshot: Funding rates, open contracts, trading volume and clearing volume
In addition to the chart itself, derivatives data can also more clearly reflect the trader's positions. We start with the funding rates.
$ANSEM's OI-weighted funding rate has remained largely positive over the past few weeks…
ANSEM Token Forecast: Funding Rate
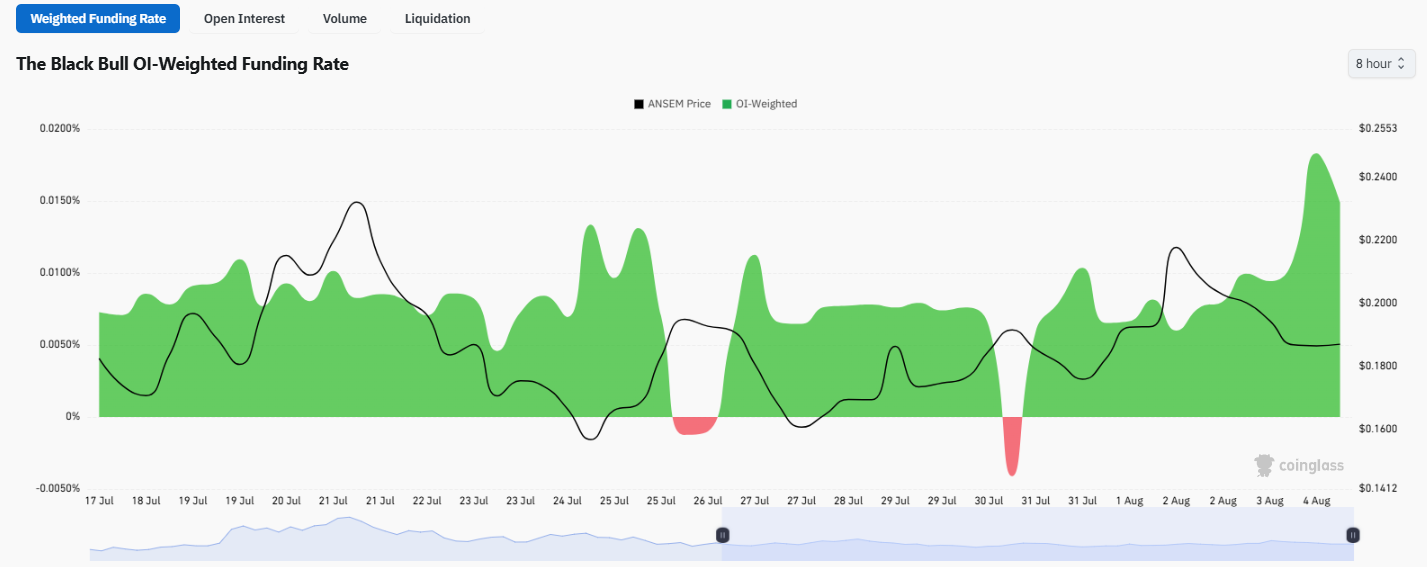
ANSEM's OI-weighted funding rate has remained largely positive over the past few weeks, ranging from 0.005% to 0.015%, indicating that long positions have been paying fees to short positions. There were two brief negative funding rates in late July and around July 30 and 31, which coincided with short-term corrections, and then quickly turned positive when prices rebounded in early August.
ANSEM Price Forecast: Open interest contracts
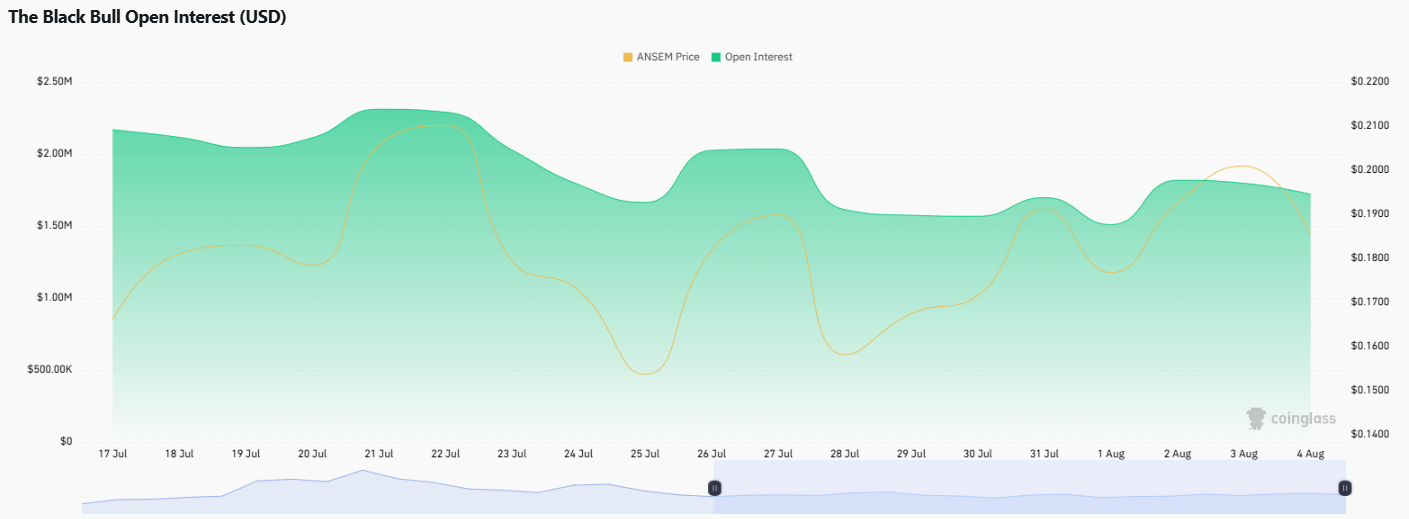
Open interest contracts fluctuate between approximately US$1 million and US$2.3 million, peaking at nearly US$2.3 million around July 21 - 22, before falling in late July. In early August, open interest rebounded again and climbed to approximately $1.8 million with the recent price rebound, indicating a new position layout in the market.
ANSEM token forecast: Trading volume
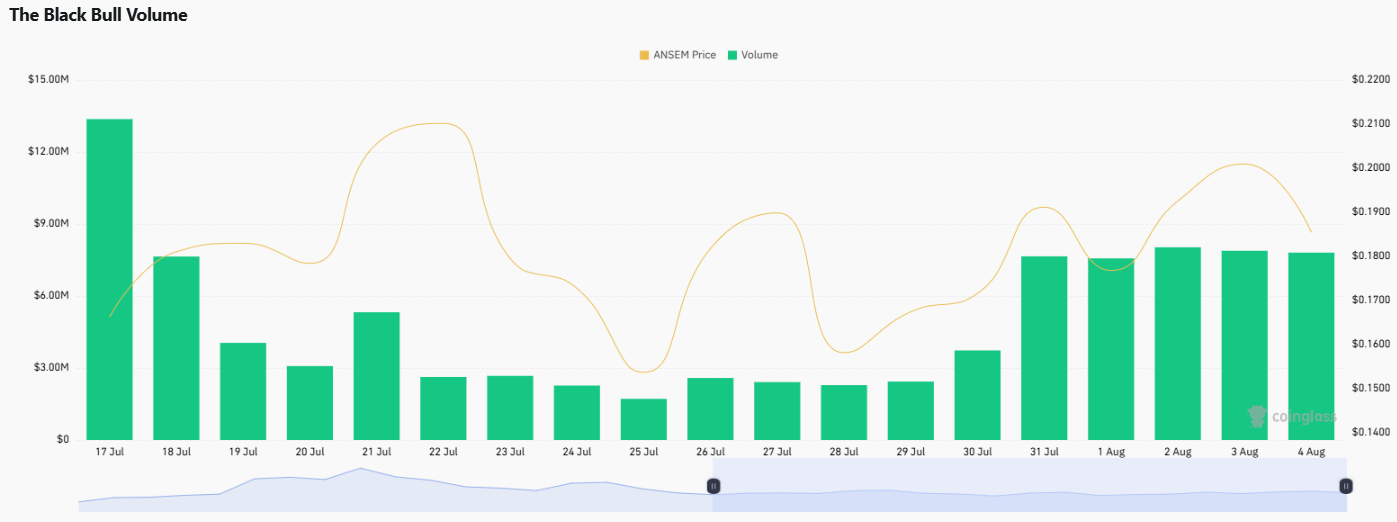
Daily trading volume surged to approximately US$13 million on July 17, then cooled down in the following week, bottoming out between US$1.5 million and US$2.9 million around July 24 and 25. Trading volumes have rebounded again since July 31 and remained in the range of US$6 million to US$7 million in early August, consistent with the recent price recovery.
ANSEM Price Forecast Chart: Technical Analysis
Trading Pair: $ANSEM/USDT ·Market: Spot (cryptocurrency)·Exchange: KuCoin ·Timeframe: 4 hours·Data source: TradingView ·Timestamp: August 4, 2026, 14:28 UTC+5:30
$ANSEM is currently trading at $0.1858, having previously broken through an uptrend line that has been a support level since its July 28 low. Prices rose strongly above this trend line, briefly touching the resistance areas of US$0.2288 and US$0.2096, followed by a correction, and are currently consolidating in a narrow range above the breakout level. The exponential moving average (EMA), a momentum indicator that focuses more on the weight of the recent candlestick chart, clusters are located in similar positions, with the shorter cycle EMA at US$0.1914 and the longer cycle EMA at US$0.1881, both slightly higher than the current price, constituting a near-term resistance that the consolidation still needs to break through.
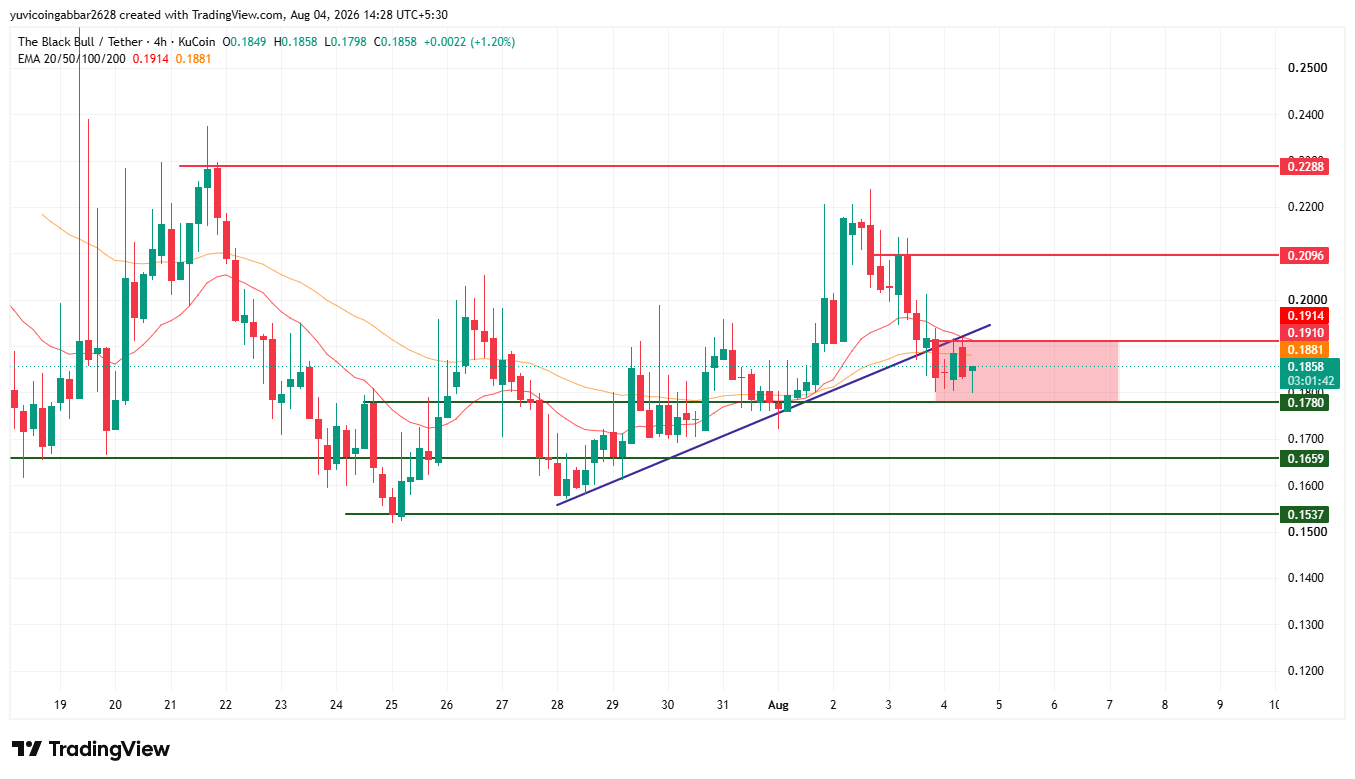
Support and Resistance
Horizontal Type| Price
Resistance level 3| US$0.2288
Resistance 2| US$0.2096
Recent Resistance Level 1| US$0.1910
Current reference price| US$0.1858
First Support Level| US$0.1780
Deeper support| US$0.1659
Bottom of Structure| US$0.1537
EMA Level
EMA| Price
EMA (20)| US$0.1914
EMA (50)| US$0.1881
Black Ox Forecast: Bull Scenario vs Bear Scenario
2026 ANSEM Price Target: Bull Scenario
If it can remain above the support area of US$0.1780 and break through the EMA cluster near US$0.1881 to US$0.1914, it will confirm that the breakthrough is stabilizing rather than receding. Continuing to stand above the recent resistance level of $0.1910 will open the way for prices to rise to $0.2096 and eventually reach $0.2288.
2026 ANSEM price target: Bear market scenario
If it falls below US$0.1780, it will confirm that the trend line has been breached, and the next downward target will be a lower level such as US$0.1659 or US$0.1537.
$ANSEM price target: Can it reach US$0.2288?
US$0.2288 is the highest resistance level marked on the chart. To reach this level,$ANSEM needs to first break through the EMA cluster around $0.1881 to $0.1914 and the recent resistance level of $0.1910, and then stand firm above $0.2096. This will be a multi-stage process rather than a unilateral market.
What factors will negate the bullish pattern?
If the price encounters rejection in the EMA cluster and around US$0.1910, and then closes back below the US$0.1780 support area, the validity of this breakthrough will be called into question. If it falls further below US$0.1659 and US$0.1537 at the bottom of the structure, it will completely destroy the current recovery structure.
2026 Black Ox Price Forecast: Expert Opinion
According to CoinGabbar analysts, in the short term: Buyers have been in control of the situation since late July, and the correction from the high of $0.2096 currently looks more like a consolidation than a reversal. Open interest and trading volume both rebounded in early August, while clearing activity has been minimal since mid-July, indicating that the current trend is not driven by leveraged positions that may be quickly closed. The US$0.1780 to US$0.1910 area is a key battlefield: if you hold this area, the breakthrough logic will still hold; if you lose this area, it means that the recovery of the trend line is just a short-term squeeze.
Black Ox Price Forecast: Data source
Price and EMA data are quoted from the 4-hour $ANSEM/USDT chart provided by TradingView on the KuCoin platform, with a timestamp of August 4, 2026 at 14:28 UTC+5:30. Market capitalization, fully diluted valuations, trading volume and supply data are quoted from CoinMarketCap. Funding rates, open interest, trading volume and clearing volume data are referenced from Coinglass.






















