
 Exchange Ranking
 Top Exchanges
 24h Volume Ranking
 Popularity Ranking
 Exchange BTC Balance
 Proof of Reserves
 Decentralized Exchanges
 Funding Rate
 Funding Heatmap
 Liquidation Data
 Max Pain
 Long/Short Ratio
 Whale L/S Ratio
 Binance/Okex/Huobi L/S
 Bitfinex Margin L/S
 ETF Tracker
 Solana ETF
 XRP ETF
 Hong Kong ETF
 Bitcoin Treasuries
 Crypto Reversal
 Ethereum Reserves
 HyperLiquid Wallet Analysis
 Hyperliquid Whale Watch
 Large Transactions
 On-chain Movement
 Bitcoin ROI
 Stablecoin Market Cap
 Options Analysis
 News
News Articles
 Economic Calendar
 Features
 Wallet
 Contract Calculator


 Security
 Collections
 Watchlist
 Following
 DOGE
DOGE Dogecoin began as a joke in 2013, when two developers grafted the Shiba emoji on the Litecoin fork, and they didn't even want to create anything earth-shattering. The result was unexpected. It survived crashes, celebrity tweets, and entire market cycles, and it survived long after currencies that had a more "serious" roadmap died. Now, we have ushered in a new January, and it is time to analyze the dog coin price forecast. Currently,$DOGE prices hover around $0.0702, and everyone wants to know a simple question: What happens next?
Dogecoin price forecast: Real-time market data
Currently, the trading price of $DOGE is US$0.0702, up 0.5% within the day. 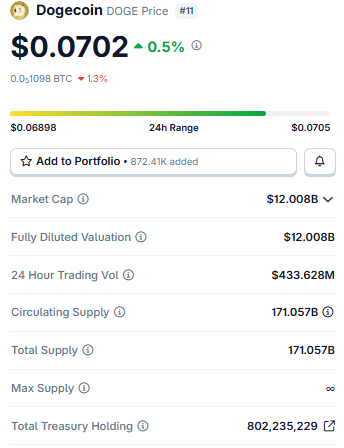
has a market value of approximately US$12.008 billion. Since $DOGE has no maximum supply limit, its fully diluted valuation is exactly consistent with this figure and no dilution calculation is required. The circulation supply and total supply are both 171.057 billion coins. The daily trading volume of US$433.628 million ensures sufficient market liquidity, while publicly tracked treasury positions exceed 802 million DOGE units, a transparency that is beyond the reach of many established currencies.
On-chain data and market drivers
The liquidation heat map is currently releasing complex signals and deserves attention. In the past 24 hours, short positions were cleared by $258.82 million, while long positions were cleared by $169.81 million, indicating that short bets were in the wrong direction as the price of $DOGE rose. But a closer look in recent hours shows that the situation has completely reversed. 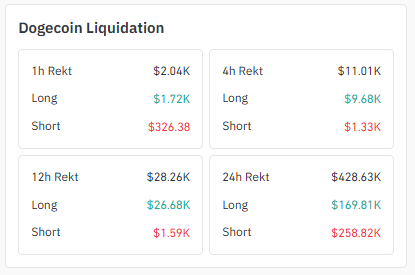
During the 12-hour window, long positions were cleared by US$26.68 million and short positions were only US$1590; the situation was similar during the 4-hour window. So the larger trend did punish the bears, but the recent pullback caught the bulls off guard.
In terms of exchange trading volume, Binance is far ahead with US$250.9 million, exceeding the combined value of almost all other platforms. OKX followed closely with $158.91 million, Bybit with $73.65 million, and MEXC with $67.24 million. 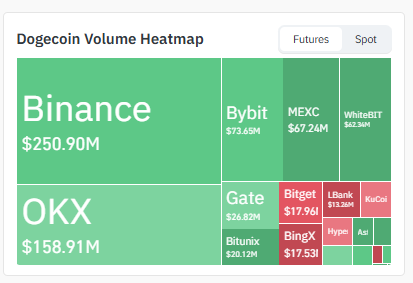
Head exchanges have such a deep order book, which usually means that real price discovery is underway, rather than a shallow order book manipulated by a single player.
Dogecoin Today's News
Recent market sentiment around $DOGE tends to be bullish, and this sentiment is mainly driven by major news of whale buying rather than a single technical indicator. The hotly debated US$200 million DOGE purchase is consistent with the broader pattern of increased holdings that has quietly formed in recent weeks.
As for whether this will form a confirmed breakthrough and break away from the downward channel, it is still an open question that no one can answer. Historically, once the key trend line is finally breached, the rise in $DOGE tends to come quickly and often outpaces other, more moderate altcoins, which is why traders are paying so close attention to this channel test.
Technical analysis of dogcoin
1-hour trend chart analysis
Zoom into the hourly chart, DOGE is squeezed into an asymmetric triangle, and two convergent trend lines push the price to the peak. 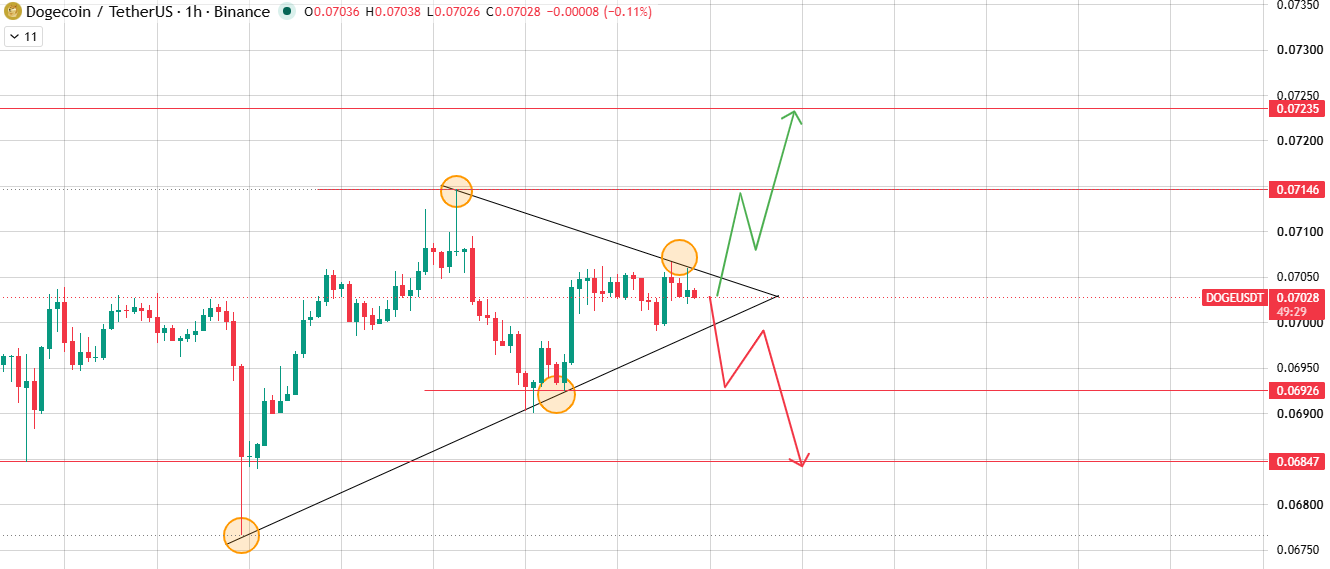
Resistance is at US$0.07146 and US$0.07235. Support is at $0.06926 and $0.06847. In the event of a bullish breakout supported by volume, prices will quickly break through the upper trend line and rush towards these resistance levels. Conversely, a break below US$0.06926 will constitute a bearish breakthrough and will open the door to US$0.06847 and lower. Such tight triangles usually don't remain silent for long.
Daily chart analysis
Daily chart signals are not ambiguous.$ DOGE has been confined to a clearly marked downward channel for weeks, oscillating back and forth between the upper boundary of descent and the lower boundary of descent. 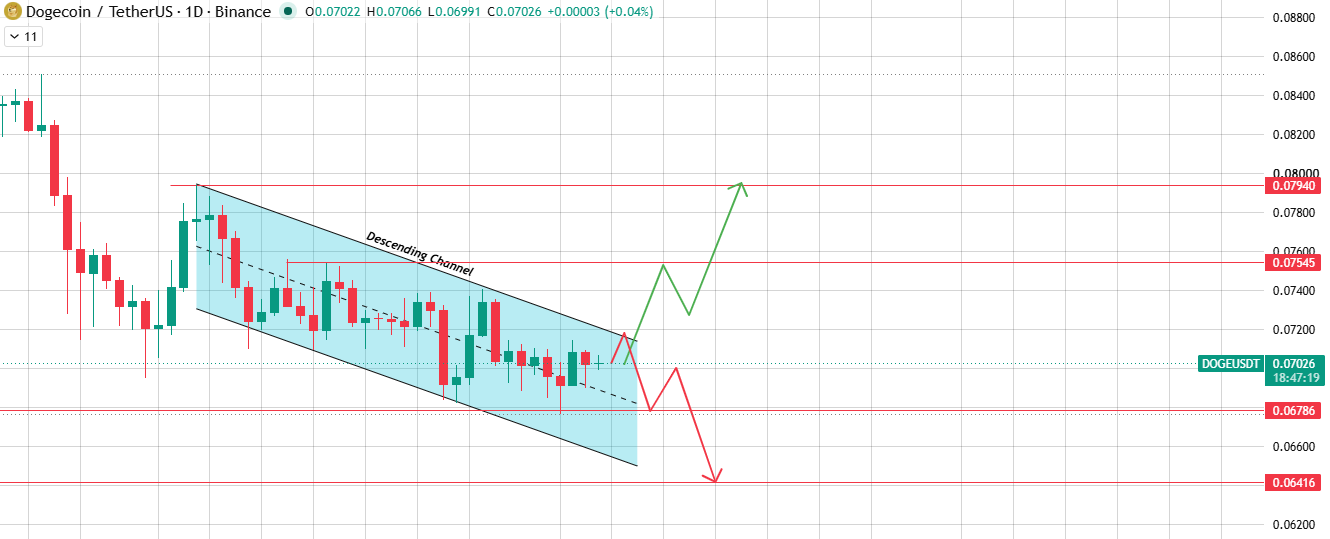
Prices are currently being tested on the upper boundary. If we can break through the first line of defense of the structure of US$0.07545 and match it with real trading volume, the next reasonable target is US$0.07940. However, if it is rejected again here, it risks falling back to US$0.06786. If selling intensifies, subsequent support will be around US$0.06416. This is a textbook-style channel test. The next few weeks will likely depend on the outcome of this trend.
Bullish, neutral, bearish scenarios
Bullish scenarios: The trigger condition is that the daily closing price is above US$0.07545 and the target price is US$0.07940.
Neutral scenario: Prices fluctuate in the downward channel, with a target range of US$0.06786-US$0.07545.
Bear scenario: Break below the channel support area, target price of US$0.06416.
What breaks a bullish scenario? The price fell back after encountering heavy selling at $0.07545. What breaks a bearish scenario? The buyer stuck to the $0.06786 defense line and refused to give up.
A catalyst worthy of attention
whale increase is currently the most watched story. A widely watched dogcoin-related account pointed out that the big wallet absorbed another 200 million DOGE pieces on Robinhood, worth nearly US$14 million. Can this guarantee a breakthrough? No. But it does show that big players believe the current price point is valuable, which in itself deserves attention.
In addition to focusing on whale movements,$DOGE's price target is still closely related to BTC's market share, and the downward trend in the market share chart usually gives meme more breathing room. DOGE and ETH are not as correlated as most altcoins, but the overall risk appetite across the market still sets the tone. Pay close attention to volume when prices approach $0.07545.
Long-term outlook
lengthens the horizon, and $DOGE is still far below its historical high in 2021, which is mainly driven by a round of cyclical retail enthusiasm. This emotion may not reappear in exactly the same form. Somehow, however, the currency remained in the top ten by market capitalisation after experiencing multiple bear markets that eliminated projects that theoretically had stronger fundamentals. Continued and effective breakthroughs in the current downward channel will be an encouraging signal from a technical perspective, but a true long-term recovery may require support from broader cryptocurrency market forces, not just the spark of DOGE itself. Holding the lower boundary of the channel when falling back is still an indicator worthy of attention.
How to buy dogcoin
Buying DOGE is not complicated. It is listed on almost all major exchanges, and you can choose from Binance, OKX, Bybit, and MEXC. Deposit funds, search for DOGE/USDT trading pairs, and issue market orders or limit orders. First operation? Start with small amounts. Market sentiment changes rapidly, and excessive positions will amplify the risks brought by such fluctuations. Once you hold a certain amount of tokens, it is recommended to transfer them to the wallet you control rather than leaving them on the exchange.
Glossary
Downward channel: Two parallel downward trend lines, one connecting the lower high point and the other connecting the lower low point. Prices are limited to the channel until they finally break through.
Symmetric triangle: Two trend lines gradually approach from opposite directions, forming a convergent pattern. The narrower the gap, once a breakthrough is made, the more volatile prices are usually.
Liquidation heat chart: Can be seen as a "pain map" that clearly shows where over-leveraged long and short positions are forced to close when prices hit a certain level.
Support area/resistance level: The position on the chart where buyers or sellers have previously intervened on a large scale. This is no guarantee that they will reappear, but traders will still keep a close eye on these areas.
BTC market share: Bitcoin's share of the overall cryptocurrency market. When this ratio falls, altcoins and meme coins usually gain more room to rise.
Methodology
Price levels are directly derived from TradingView charts on the 1-day and 1-hour lines; clearing and volume data are derived from Coinglass; no inferences are made about data outside the visible chart structure.






















