Exchange Ranking
 Top Exchanges
 24h Volume Ranking
 Popularity Ranking
 Exchange BTC Balance
 Proof of Reserves
 Decentralized Exchanges
 Funding Rate
 Funding Heatmap
 Liquidation Data
 Max Pain
 Long/Short Ratio
 Whale L/S Ratio
 Binance/Okex/Huobi L/S
 Bitfinex Margin L/S
 ETF Tracker
 Solana ETF
 XRP ETF
 Hong Kong ETF
 Bitcoin Treasuries
 Crypto Reversal
 Ethereum Reserves
 HyperLiquid Wallet Analysis
 Hyperliquid Whale Watch
 Large Transactions
 On-chain Movement
 Bitcoin ROI
 Stablecoin Market Cap
 Options Analysis
 News
News Articles
 Economic Calendar
 Features
 Wallet
 Contract Calculator


 Security
 Collections
 Watchlist
 Following
 SHIB
SHIB Shiba Inu Price Forecast: Analysis of the Current Situation
So, what is the current position of Shiba Inu Price Forecast? It mainly depends on patience. This is a meme coin that once made millionaires overnight, but this year has passed sideways, well below its all-time high, while the entire market is absorbing volatility. The current price is about US$0.000046, and the market value is close to US$2.7 billion, still ranking among the top 40 in the market value of cryptocurrencies. Anyone who buys during the craze of 2021 is already familiar with this rhythm: long periods of inaction, followed by sudden fluctuations that no one expected. This is basically the current situation-a ready form, rather than a currency that moves violently in one direction.
$SHIB real-time market data
The current trading price of Shiba Inu Coin is US$0.00000464, down 0.4% within the day. The price range over the past 24 hours has been narrow, ranging from $0.0000457 to $0.0000466. 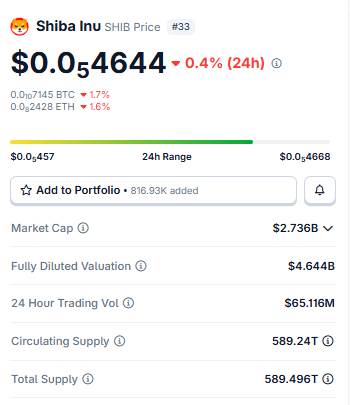 The market value is close to US$2.736 billion, and the fully diluted valuation is approximately US$4.644 billion. The 24-hour transaction volume was US$65.116 million, the circulation supply was 589.24 trillion pieces, and the total supply was 589.496 trillion pieces.
Clearing data
Bulls continue to suffer. In the past hour alone,$111.04 was cleared, all from long positions. Stretch the time to four hours, and the total liquidation amount reached US$1030, of which long positions accounted for US$111.04 and short positions accounted for US$916.39. 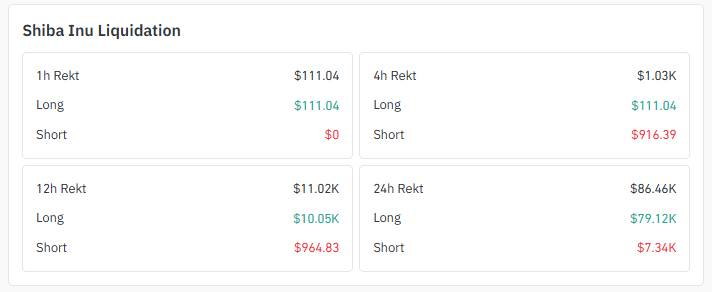 Within twelve hours, the liquidation amount was US$11020, with the long position accounting for US$10050. And the past day? The liquidation amount was US$86460, of which the long positions absorbed US$79120, and the short positions only accounted for US$7340. Lever-hunters have been tricked repeatedly, and the situation is clear at a glance.
Exchange trading volume
OKX dominates SHIB futures trading, with trading volume reaching US$14.14 million and still growing. LBank followed closely with trading volume of US$7.36 million, and MEXC ranked third with US$6.76 million. 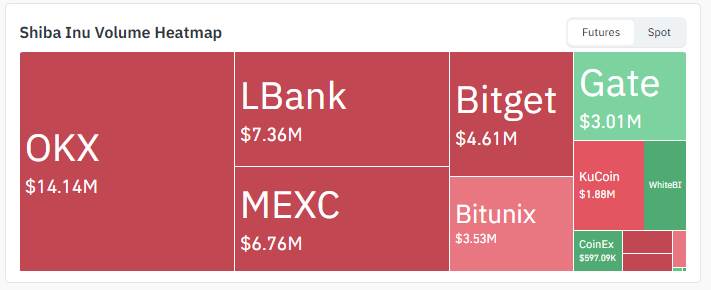 Bitget contributed $4.61 million, Bitunix contributed $3.53 million, while Gate, KuCoin and CoinEx shared the remaining smaller share.
Key Points
SHIB is currently near US$0.00000464, just below a key daily trend line. This is the core of this Shiba Inu price forecast. On the 4-hour chart, prices are squeezed into a downward channel. The direction of breakthrough will determine the next wave of trend. If it breaks through US$0.0000517 supported by trading volume, the upside will open to US$0.0000670. If support falls short, US$0.0000406 will quickly come back to view. Bulls are still bleeding; a clearing amount of $86460 in 24 hours speaks for itself.
Technical analysis of Shiba Inu price forecast
In-depth analysis of the chart behind this Shiba Inu price forecast, the following is an interpretation of the two time frames.
$SHIB 4-hour chart analysis
$SHIB prices are in a downward channel on the 4-hour chart. 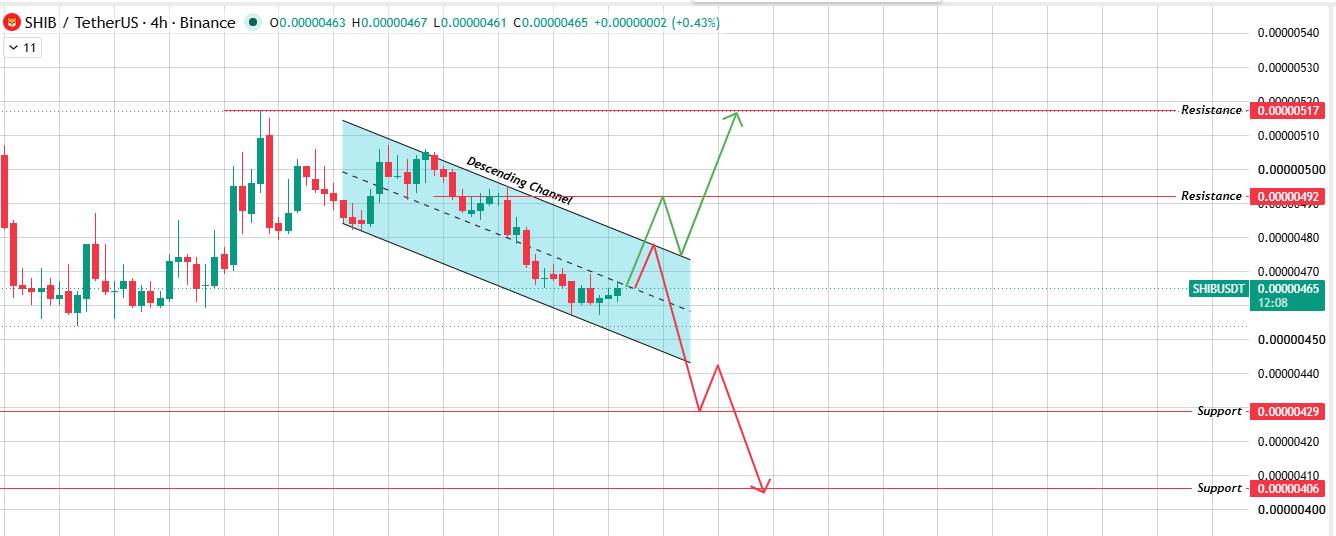 If the upper track of the channel is broken through with volume, the price will first test the resistance level of US$0.0000492 and then US$0.0000517. If the price encounters obstacles on the upper track and falls below the lower track, it will test the support level of US$0.0000429, followed by US$0.0000406.
$SHIB Daily Chart Analysis
Trend lines extending from the previous wave of highs have suppressed every rebound so far, including sharp gains in the demand area from US$0.0000455 to US$0.0000460. 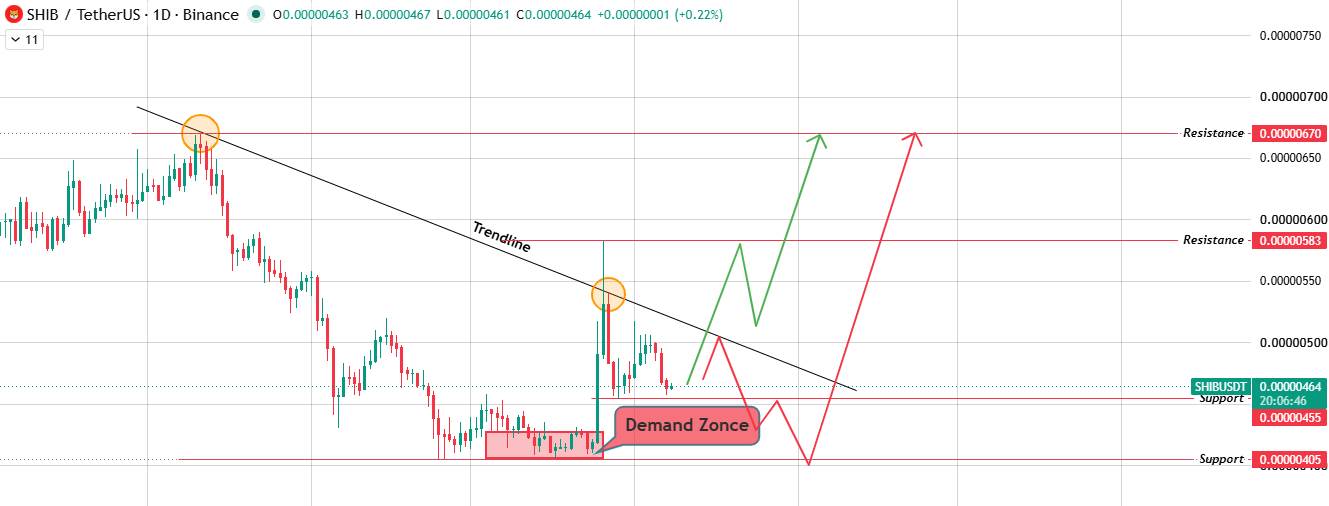 If the trend line is broken with the cooperation of trading volume, US$0.0000583 will open up upside, followed by US$0.00000670. On the contrary, if you encounter obstacles and fall back into the demand area, if US$0.0000405 falls below, it will become a price that needs attention.
Bully, neutral and bearish scenarios
Let's start with the 4-hour chart.$ SHIB is limited to a downward channel. If it breaks through the upper channel with volume, buyers will first push the price to US$0.0000492 and then to US$0.0000517. If you encounter obstacles here? Then it will fall below the bottom line, and sellers are likely to lower the price to $0.0000429, or even drop to $0.0000406. Stretch the perspective as far as the daily chart, and the same tension is shown from different angles. Prices remain suppressed below a longer downtrend line. If the trend line is exceeded with the cooperation of trading volume, market sentiment will turn bullish. However, if you encounter a blockage and fall back into demand, it is not necessarily bad news; a liquidity sweep in the region may wash out weak positions, and prices may then reverse upward. Current neutral situation? Shock. Wandering between the demand area and the trend line until one party truly breaks through.
Glossary
Imagine two tilted parallel lines framing prices in a stable downward trend. This is the downtrend. Traders look at the edge of the channel for signals of a break or break. What is a downtrend line? A diagonal line connecting successively decreasing highs acts as a ceiling until the price finally closes above it. Demand areas refer to price areas where buyers have previously been actively involved enough to reverse declines and are therefore considered potential support levels. Have you ever heard of liquidity sweeps? This means that prices quickly pierce through a clear level of support or resistance, triggering a stop order before the price reverses direction. Liquidation, on the other hand, means that the exchange forcibly liquidates leveraged positions due to losses that exhaust the trader's margin.
Methodology
Each price point in this Shiba Inu price forecast is directly derived from the 4-hour chart and daily chart analysis. Clearing data comes from Coinglass, and exchange trading volumes come from real-time futures heat maps. This article does not provide any extrapolation of what the chart actually shows.
Disclaimer : This document is for information purposes only and does not constitute financial advice. The cryptocurrency market is highly volatile and speculative. Estimated probabilities reflect technical analysis of chart shape rather than certainty. Always conduct independent research and consult a licensed financial adviser before making an investment decision.