Exchange Ranking
 Top Exchanges
 24h Volume Ranking
 Popularity Ranking
 Exchange BTC Balance
 Proof of Reserves
 Decentralized Exchanges
 Funding Rate
 Funding Heatmap
 Liquidation Data
 Max Pain
 Long/Short Ratio
 Whale L/S Ratio
 Binance/Okex/Huobi L/S
 Bitfinex Margin L/S
 ETF Tracker
 Solana ETF
 XRP ETF
 Hong Kong ETF
 Bitcoin Treasuries
 Crypto Reversal
 Ethereum Reserves
 HyperLiquid Wallet Analysis
 Hyperliquid Whale Watch
 Large Transactions
 On-chain Movement
 Bitcoin ROI
 Stablecoin Market Cap
 Options Analysis
 News
News Articles
 Economic Calendar
 Features
 Wallet
 Contract Calculator


 Security
 Collections
 Watchlist
 Following
 DOGE
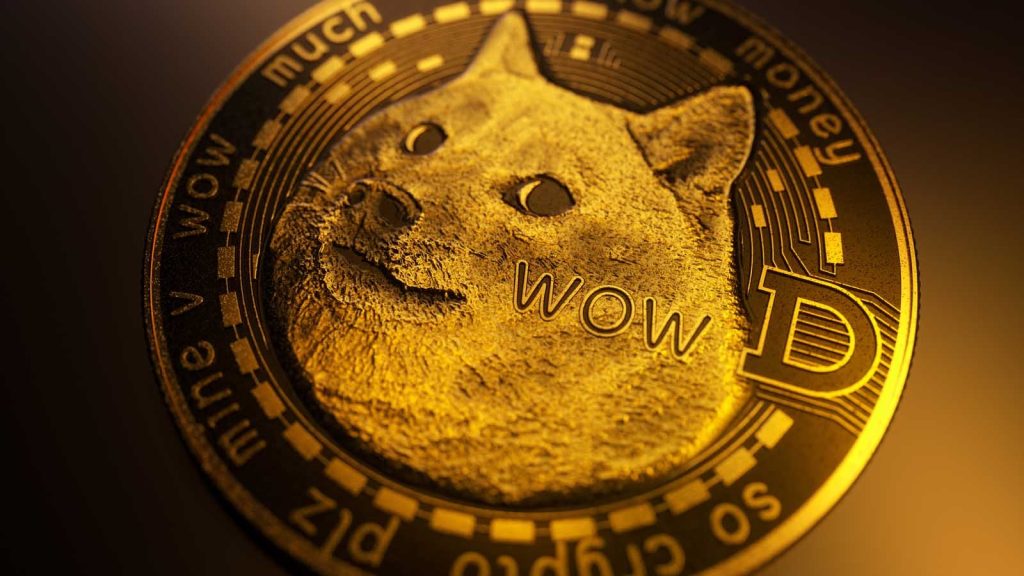
DOGE Today's market analysis of dogcoin: sideways consolidation and ready to go
Today's dogcoin market was calm, with the price rising slightly around US$0.07, still a long way from the US$0.75 high set in the previous major cycle. The current market value is close to US$10.9 billion, which is enough to rank among the top 15 in the market value of cryptocurrency assets. The story of this currency has always relied on community energy, followed by the technical level, and this has not changed. But at present, it is more sideways than forming a trend, which is also the key to this Dogecoin price forecast -it depends on which direction the current range will eventually break through.
Real-time market data
The current trading price of Dogecoin is 0.07037 US dollars . It has risen 1.2% in the past 24 hours. Intra-day fluctuation range: $0.0694 to $0.07054. Market value: $10.935 billion, which is in line with the fully diluted valuation, as almost all supply is already in circulation.
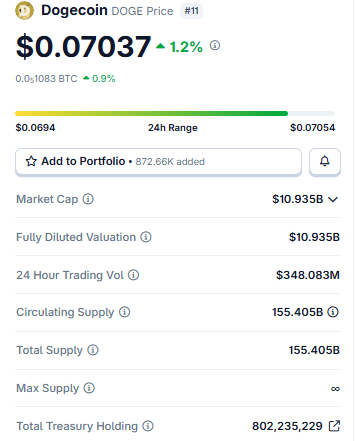
Trading volume in the past 24 hours was US$348.83 million. The circulation supply and total supply are both 155.0405 billion coins. There is no maximum supply limit. Currently, the treasury holds approximately 802.2 million DOGE coins.
Clearing data
Short-sellers have been in a difficult situation recently and the gap is wide. Last hour: $8470 was liquidated, all short positions. In the past 4 hours: A total of US$27870 has been cleared, of which US$26420 has been accounted for by short positions and US$1450 has been accounted for by long positions.
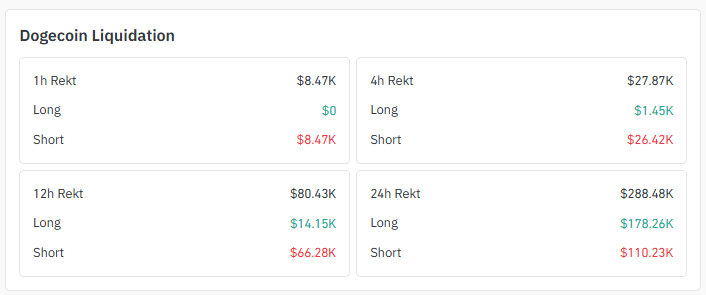
In the past 12 hours, short positions have still dominated, accounting for $66280 of the total $80430 in liquidation. However, lengthening the time to a full day, the situation reversed: the bulls led the lead with a liquidation amount of $178260, and the shorts were $110230, for a total of $288480.
Exchange trading volume
Binance leads the way with US$207.34 million in dogcoin futures trading volume, which is difficult for other exchanges to match. OKX ranked second with $139.73 million, and WhiteBIT ranked third with $82.43 million.
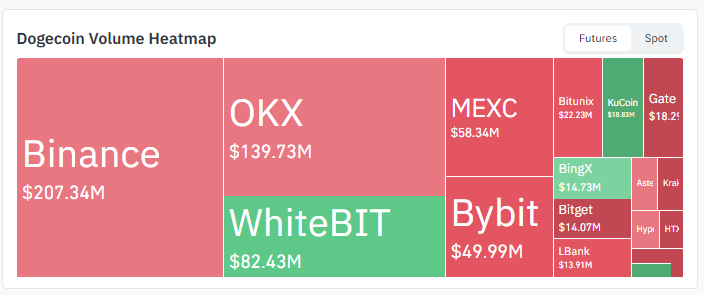
MEXC recorded US$58.34 million, compared with US$49.99 million for Bybit. Bitunix, KuCoin, Gate and BingX constitute the main echelon after that.
Today's Dogcoin News
The hot topic in the market compares the current price of DOGE with its historical high, and the view is that anyone who missed a fixed investment in the past year now has the opportunity to add to a position.
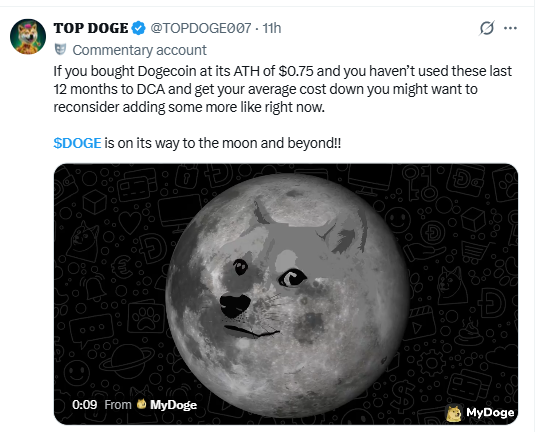
This is certainly a bullish view that usually occurs when DOGE is trading well below its peak. But it is worth keeping in mind that this is just a perception in the market and not a guarantee of price movements.
Key Points
US$0.07037. DOGE rose 1.2% within the day, which is the benchmark for this dogcoin price forecast.
The 1-hour chart shows a rising triangle. If the upper boundary is exceeded, US$0.07149 For the first target, followed by $0.07235. What if I break through downwards? $0.06963 will quickly enter view, followed by $0.06873.
The 4-hour chart is in a sideways consolidation state with an uncertain direction. An upward breakthrough pushed the price to US$0.07365 , then US$0.07705. For a downward breakthrough,$0.06723 came into view, followed by $0.06316.
Short-term shorts are at a disadvantage in most clearing windows.
Technical analysis is the core of this dogcoin price forecast.
The actual trend of the two time frames supporting this dogcoin price forecast
DOGE 1-hour chart analysis
The current trading price of dogcoin is US$0.07042, and is currently in the rising triangle pattern.
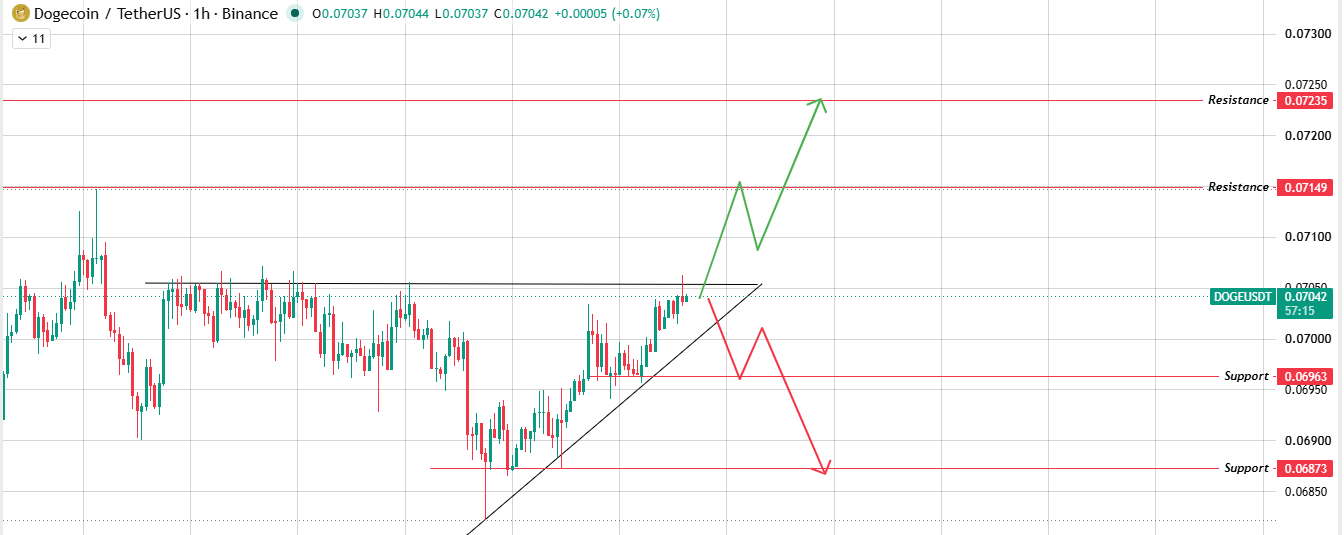
Break through the upper boundary and prices will move towards higher levels, first US$0.07149, then US$0.07235. If a downward breakthrough is made, the lower level will take over, which is $0.06963, followed by $0.06873.
DOGE 4-hour chart analysis
In the 4-hour chart, the dogcoin is still arranged sideways and its direction is uncertain.
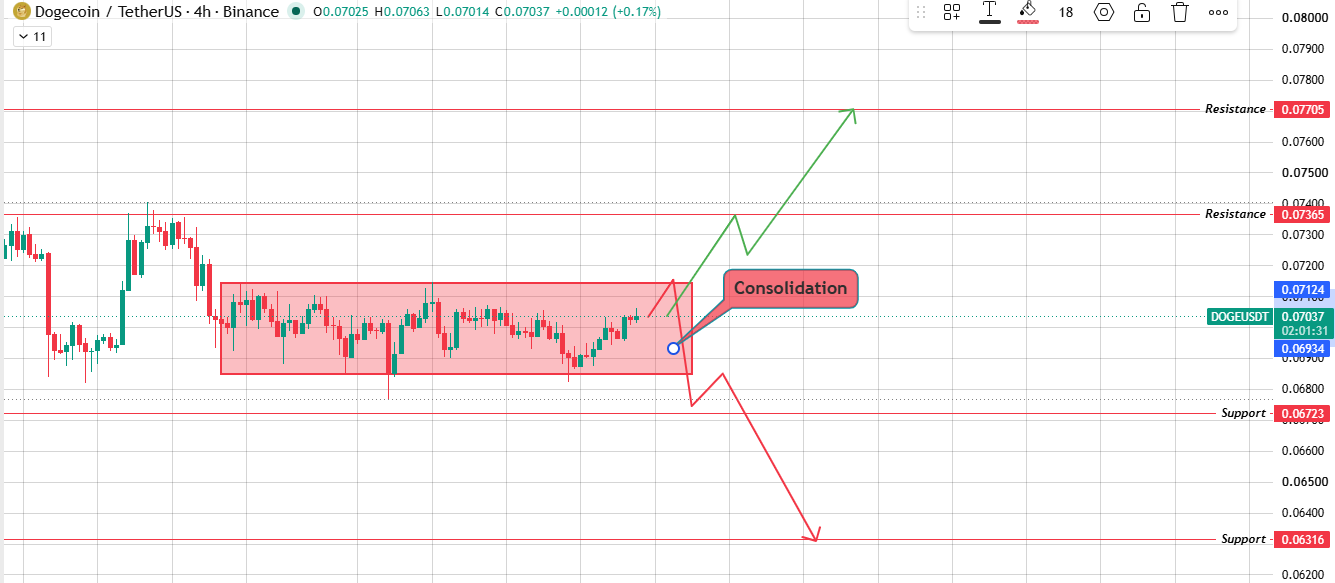
Regardless of the direction of the breakthrough, prices will move with it. The upward breakthrough was first $0.07365, then $0.07705. The downward breakthrough was $0.06723, followed by $0.06316.
Analysis of bull market, neutral and bear market scenarios
The three possible trends in this dogcoin price forecast are detailed below.
Scenario| trigger condition| Target Price
Bull Market| The upper boundary of the 1-hour triangle was broken, and at the same time, the 4-hour interval also broke upward. | First, they were $0.07149 and $0.07235, then forward at $0.07365 and $0.07705.
Neutral| Prices are trapped within the current 1-hour and 4-hour intervals and have not been able to form a clear breakthrough. | Prices fluctuated repeatedly, roughly between $0.06963 and $0.07149.
Bear Market| The 1-hour triangle broke downward, and the 4-hour interval also failed downward. | First, it was $0.06963 and $0.06873, and then it was $0.06723 and $0.06316 in the range.
Explanation of terms
Higher lows continue to impact the horizontal resistance line until prices finally choose to break through in one direction, which is the rising triangle . Traders often refer to price ranges as "sideways consolidation": prices fluctuate horizontally between upper and lower levels to accumulate energy for subsequent movements. Resistance level : refers to the area where previous selling has suppressed price gains, making the first breakthrough more difficult than it seems. Support , on the other hand, is a level that bulls continue to hold on until they are unable to defend.
Methodology
The prices in this dogcoin price forecast are derived from an analysis of 1-hour and 4-hour charts. Clearing data comes from Coinglass, and exchange trading volumes come from real-time futures heat maps.
Disclaimer : This document is for information purposes only and does not constitute any financial advice. The cryptocurrency market is highly volatile and speculative. The estimated probability reflects technical analysis based on chart form and is not a deterministic conclusion. Always conduct independent research and consult a licensed financial adviser before making any investment decisions.