Exchange Ranking
 Top Exchanges
 24h Volume Ranking
 Popularity Ranking
 Exchange BTC Balance
 Proof of Reserves
 Decentralized Exchanges
 Funding Rate
 Funding Heatmap
 Liquidation Data
 Max Pain
 Long/Short Ratio
 Whale L/S Ratio
 Binance/Okex/Huobi L/S
 Bitfinex Margin L/S
 ETF Tracker
 Solana ETF
 XRP ETF
 Hong Kong ETF
 Bitcoin Treasuries
 Crypto Reversal
 Ethereum Reserves
 HyperLiquid Wallet Analysis
 Hyperliquid Whale Watch
 Large Transactions
 On-chain Movement
 Bitcoin ROI
 Stablecoin Market Cap
 Options Analysis
 News
News Articles
 Economic Calendar
 Features
 Wallet
 Contract Calculator


 Security
 Collections
 Watchlist
 Following
 DOGE
DOGE The current trading price of $DOGE is US$0.06988, which fell slightly by 0.4% today and is basically flat. Since its birth in December 2013, Dogecoin was created by Billy Marcus and Jackson Palmer as a playful parody of Shiba Inu meme, but has surprisingly lasted longer than most cryptocurrencies that take their own seriously. Today, it ranks 10th largest cryptocurrency by market capitalisation, and still relies on true community loyalty and Elon Musk's occasional attention to maintain its popularity. However, the current dogcoin price forecast has little to do with memes and more depends on two overlapping chart patterns-one on the hourly line and one on the four-hour line-that are compressing prices to a decision point.
Real-time dogcoin price data
The current trading price of dogcoin is US$0.06988, which fluctuates within the range of US$0.06913 to US$0.07085 within the day, with a decrease of 0.4%. 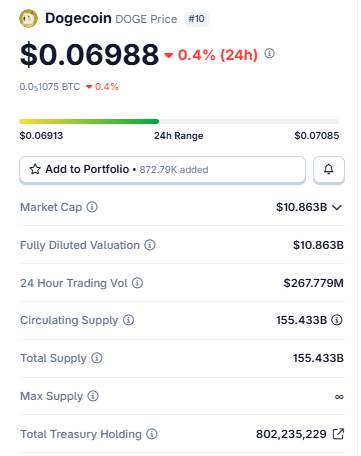 The market value is approximately US$10.863 billion. Since DOGE has no maximum supply cap, the fully diluted valuation is exactly consistent with the market value. The circulation supply is 155.433 billion pieces, and all of them have been circulated. Daily trading volume is approximately US$267.779 million. A point worth noting in this dogcoin price forecast is that the treasury positions related to $DOGE currently exceed 802 million tokens, and some traders will pay attention to this data as a signal to increase or reduce their holdings.
Clearing data and exchange trading volume
A total of US$1.1 million was cleared within 24 hours, of which long positions borne almost all the losses, reaching US$973.55 million, while short positions only US$121.87 million. 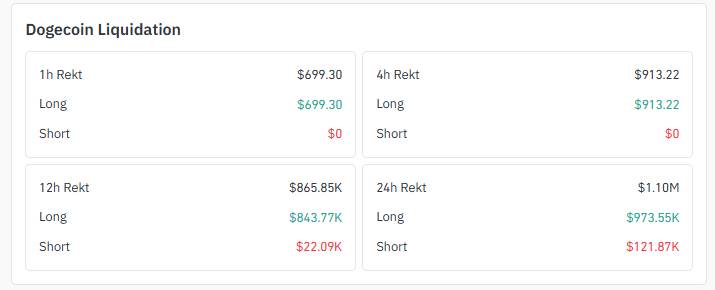 The same situation occurred in the 12-hour window, totaling $865.85 million, with bulls again dominating with $843.77 million. As for the 4-hour and 1-hour windows, only long liquidations occurred, and there was no movement on the short side. This suggests that bullish traders have been repeatedly frustrated by DOGE's sideways swings rather than sharp swings. Binance dominated trading volume, reaching US$225.48 million, more than double the volume of OKX (US$132.43 million).
 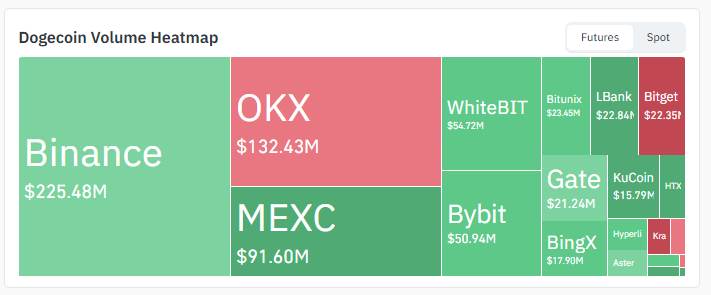 MEXC followed closely with $91.6 million, while Bybit and WhiteBIT both approached $50 million. Smaller shares are divided among Bitunix, LBank, Bitget, BingX, Gate and KuCoin.
Key Points
The market was basically flat, down 0.4%, and DOGE was around US$0.06988; currently, two patterns are superimposed: a channel and a triangle; bulls have been the main bearer of liquidation in the near future, not short positions; Binance alone has almost twice that of OKX, the second-largest exchange; no matter which direction these patterns break through first, they may set the tone for subsequent periods.
Technical Analysis: What the chart shows
Hour line chart analysis
$DOGE is limited to the falling channel. 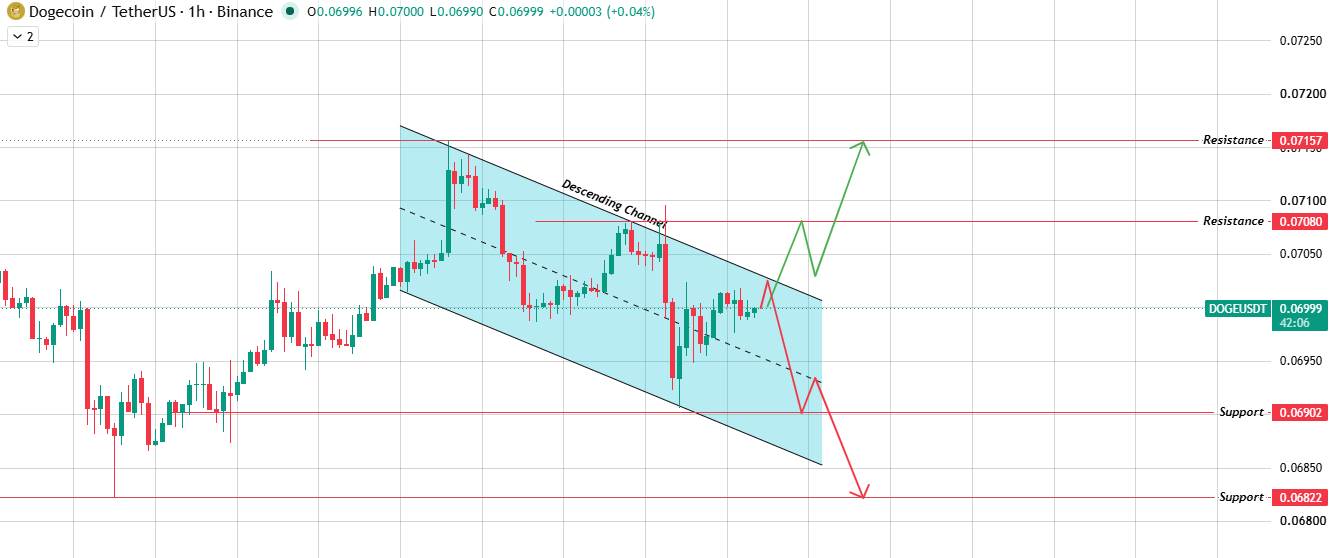 If the trading volume effectively breaks through the upper boundary, US$0.07080 will open up upside, followed by US$0.07157. On the contrary, if it is blocked and falls back at the upper boundary, it will slide towards the lower edge of the channel. Once it falls below this position, the next target will be US$0.06902, followed by US$0.06822.
4-hour chart analysis
A broader perspective shows that $DOGE is squeezed into an asymmetric triangle, with prices almost right near the apex, which usually means a direction choice is imminent. 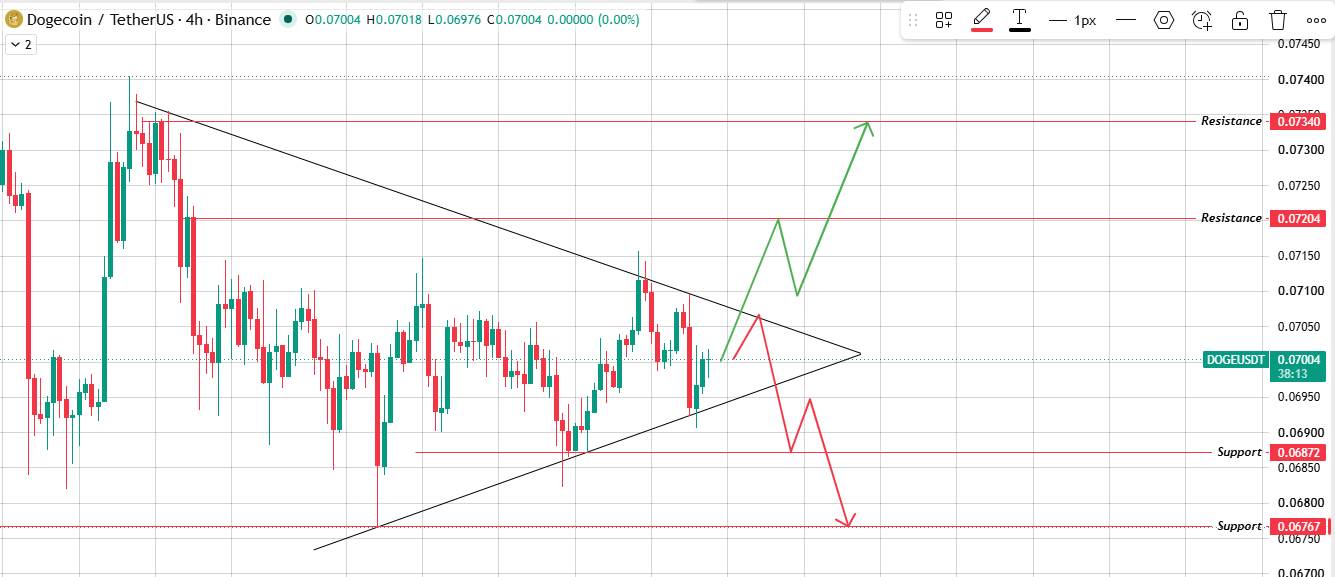 If the upper boundary is exceeded, US$0.07204 will come into view. If momentum continues, it may hit US$0.07340. If it breaks below the lower boundary, support is at $0.06872 and $0.06767 below it.
Bully, neutral and bearish scenarios
Bully scenario: Target range of US$0.07080-US$0.07340, triggered by breaking through the 1H channel and 4H triangular resistance level, and failure condition by falling back below US$0.06988. Neutral scenario: Target range of US$0.06900-US$0.07050, prices continue to be compressed into two forms, and the failure condition is that they continue to close outside either boundary. Bear situation: Target range of US$0.06822-US$0.06767, trigger condition is to break below the 1H channel and 4H triangle support, and expiration condition is to stand again at US$0.07080.
$DOGECOIN's social sentiment
Rumors are that if DOGE clears the main resistance level, it could see a sharp rise of more than 150%-this type of title always spreads quickly whenever tokens enter such a tightly organized form.  This is not unfounded; the confirmed breakthrough may indeed open up room for a larger market. However, the three-digit increase forecast belongs to a "possible scenario" rather than a "high probability outcome." This dogcoin price forecast is closer to the actual chart display than any single circulated title.
Long-term Outlook
Everything depends on how these two forms evolve. If you break through the resistance level cleanly, preferably supported by trading volume at the Binance-level, the broader dogcoin price forecast tends to be bullish, with the target looking at US$0.073 to US$0.074. On the contrary, if a downward breakthrough is made, the low range of US$0.067 to US$0.068 will become the focus. Given that prices are currently compressed so tightly, it is not expected to last long in either direction.
Glossary
Downward channel: High points are lower, low points are lower, and prices are confined between two parallel lines that slope downward. Asymmetric triangle: The resistance line slopes downward and the support line slopes upward. The two angles roughly match, and prices usually break through near the peak. Liquidation: When a trader's loss is too large to cover, the exchange forcibly closes a leveraged position. FDV (fully diluted valuation): Total supply multiplied by current price. Since DOGE has no maximum supply cap, its FDV is exactly consistent with the market value. Treasury positions: DOGE tokens held in reserves, usually associated with known large wallets or foundations, and traders sometimes track this data for buy and sell signals.
Methodology
This dogcoin price forecast is based on TradingView's chart interpretation over 1-hour and 4-hour time frames, combined with Coinglass's clearing and trading volume data. All support, resistance and profile levels come directly from the observable chart structure without any speculation. Given that current prices are tightly compressed by two forms, once either boundary actually breaks through, it is worth re-examination.