Exchange Ranking
 Top Exchanges
 24h Volume Ranking
 Popularity Ranking
 Exchange BTC Balance
 Proof of Reserves
 Decentralized Exchanges
 Funding Rate
 Funding Heatmap
 Liquidation Data
 Max Pain
 Long/Short Ratio
 Whale L/S Ratio
 Binance/Okex/Huobi L/S
 Bitfinex Margin L/S
 ETF Tracker
 Solana ETF
 XRP ETF
 Hong Kong ETF
 Bitcoin Treasuries
 Crypto Reversal
 Ethereum Reserves
 HyperLiquid Wallet Analysis
 Hyperliquid Whale Watch
 Large Transactions
 On-chain Movement
 Bitcoin ROI
 Stablecoin Market Cap
 Options Analysis
 News
News Articles
 Economic Calendar
 Features
 Wallet
 Contract Calculator


 Security
 Collections
 Watchlist
 Following
CASHCAT Price Forecast: Analysis of rebound trend and key levels
CASHCAT's current trading price is US$0.1613, an intraday increase of 42.9%. Quick background: Launched on July 1, 2026, a few days after Robinhood Chain launched, the token is built around the concept of "Cash Cat"-a name that Robinhood's founders allegedly considered before rebranding. The current rebound stems from a real catalyst: Robinhood officially launched CASHCAT in its app on August 6, 2026, attracting a new wave of buyers.
Therefore, this price forecast is actually focused on a token that is trying to recover lost ground after a full boom-bust cycle.
Real-time CASHCAT price data
$CASHCAT is currently trading at US$0.1613, up 42.9% in 24 hours. The 24-hour price range also speaks volumes about this: a low of $0.106 and a high of $0.1665. The market value is close to US$160,679 million. 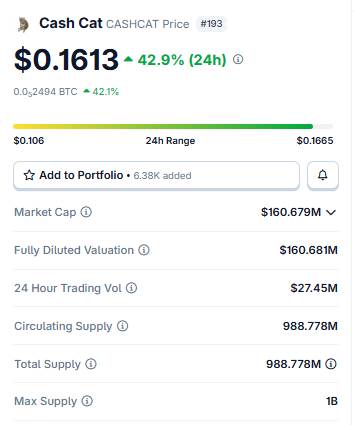
The fully diluted valuation is similar to this, at US$160.681 million, because the total supply of 1 billion pieces has been fully circulated. Daily trading volume is approximately US$27.45 million. For readers reading this price forecast, it's worth noting that there are no future unlocking plans here, and the entire supply has been released.
Clearing data and exchange trading volume
In the past 24 hours, the market has cleared a total of US$461,920, of which short bears almost all the losses-US$448.06 million, while long bears only US$13.86 million. 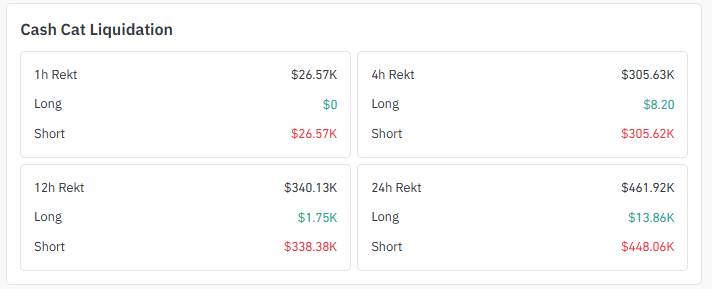
During the 12-hour and 4-hour time windows, the situation was similar, with short bears bearing most of the losses each time. Traders betting on CASHCAT's decline continue to be trapped as prices refuse to slow down. 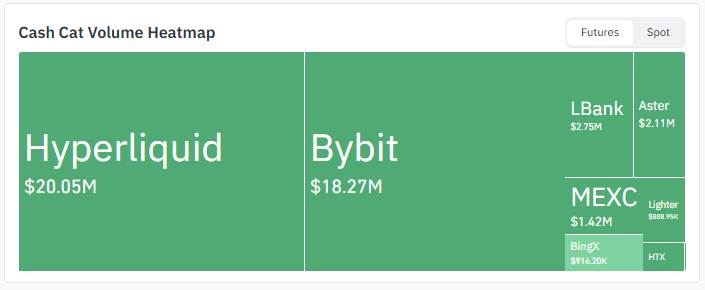
Hyperliquid led the way with US$20.05 million in transaction volume, followed by Bybit with US$18.27 million. LBank, Aster, MEXC, Lighter and BingX divided the remaining shares.
Key Points
·Today's gain was 42.9%, close to US$0.1613, a sizable one-day gain
·Still limited by the rising channel on the 1-hour chart and has not yet broken through
·In this round of gains, shorts rather than long positions are the main losing parties
· Hyperliquid and Bybit bear most of the trading volume
·No matter how the channel breaks through, Both may set the tone for subsequent trends.
$CASHCAT's market sentiment
Current discussions around CASHCAT continue to focus on its market value approaching US$140 million once again. Some people compare it with Dogecoin's staying power rather than seeing it as a one-time pull-up. 
However, this is narrative rather than technical, so it is necessary to weigh this framework against what the chart actually shows before relying too much on this price forecast.
Technical Analysis: Information displayed on the hourly chart
CASHCAT is limited to a rising channel on the 1-hour chart, and the current trading price is US$0.1618. 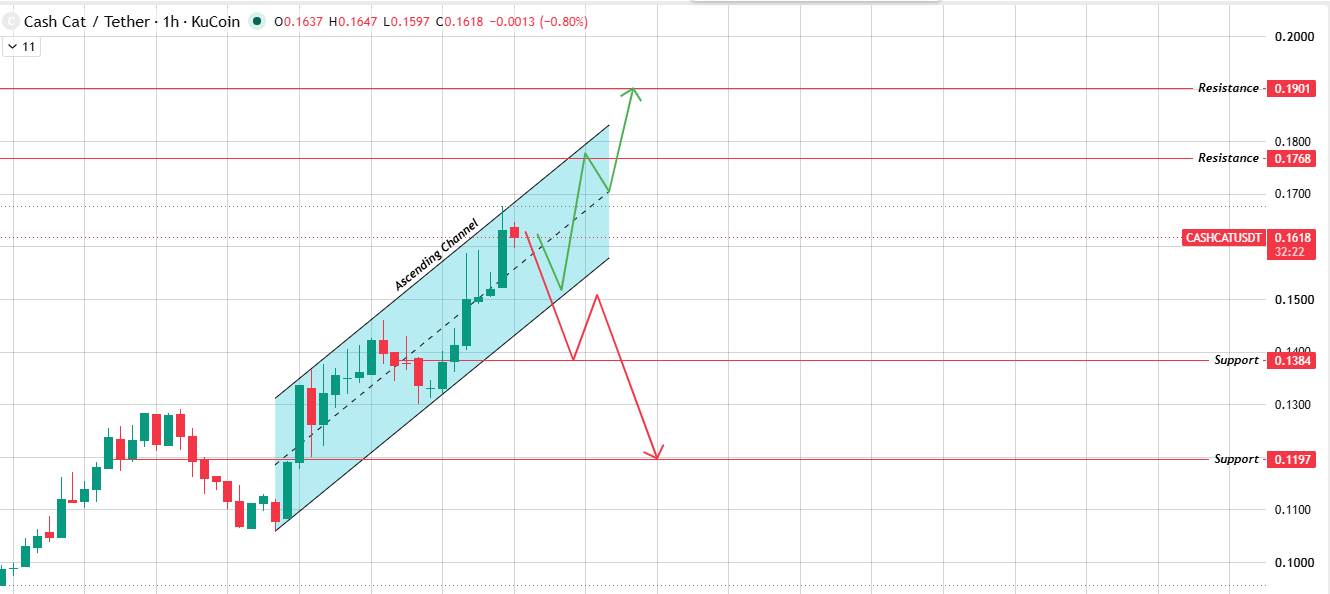
Breaking through the upper boundary of the channel, US$0.1768 is the first resistance level, and US$0.1901 is above it. If it falls below the lower boundary, the support level will be US$0.1384 and US$0.1197 respectively. However, there is no final conclusion yet, and as of the time of writing, prices are still within the channel.
CASHCAT Daily Chart Analysis
On the daily chart,$CASHCAT has regained the 0.618 Fibonacci retracement level (approximately US$0.1516) and is currently testing the 0.786 retracement level (approximately US$0.1685). 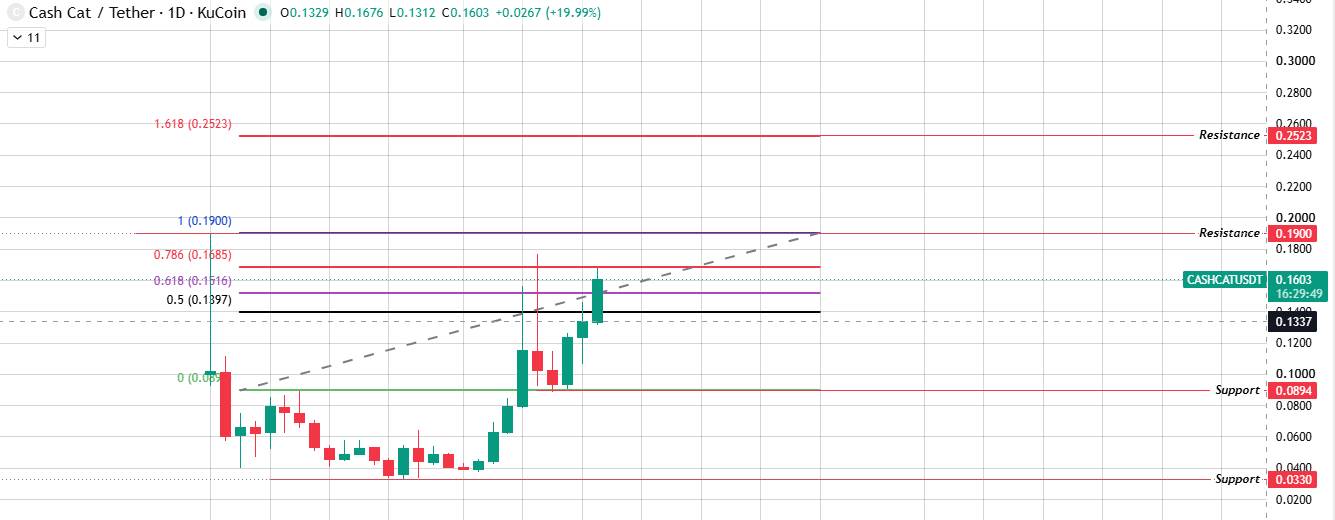
The 1.0 retracement level is close to US$0.1900, almost exactly matching the token's previous historical high area, making it a key observation level. If it is confirmed that a breakthrough of US$0.1900 will be exceeded, it will open up space for the market outlook to reach the 1.618 expansion level (approximately US$0.2523). On the downside side, support is at US$0.0894. If this level falls, deeper support is at US$0.0330. In short, the daily chart shows that $CASHCAT is recovering steadily, but still needs to break past previous highs before this price forecast turns more firmly bullish.
Bully, neutral and bearish scenarios
Bully scenario: price range 0.1768 - 0.1901 US $, triggered by a break through the 1-hour channel, and expired by falling back below US$0.1516.
Neutral scenario: price range of US$0.1384 - 0.1768, the trigger condition is that the price stays within the channel, and the failure condition is that it continues to close outside the boundary.
Bear scenario: Prices of US$0.1197 and below, triggered by falling below the 1-hour channel, and expired by re-standing at US$0.1685.
Long-term Outlook
Frankly, the key is $0.1901. If we can break through and hold this level, this price forecast will turn more bullish. If it fails at this level or falls back below $0.1384, the outlook will weaken quickly.
Glossary
Rising channel: Two parallel lines slope upward, and prices fluctuate between them. This is the rising channel in the popular sense.
Liquidation: When the exchange forcibly closes the position due to excessive losses in the leveraged position of a trader, it is liquidation.
Resistance level: Historically, sellers stepped in in this price area and prevented further price increases.
Support: As opposed to resistance, buyers have historically stepped in in this price area and prevented prices from falling.