Exchange Ranking
 Top Exchanges
 24h Volume Ranking
 Popularity Ranking
 Exchange BTC Balance
 Proof of Reserves
 Decentralized Exchanges
 Funding Rate
 Funding Heatmap
 Liquidation Data
 Max Pain
 Long/Short Ratio
 Whale L/S Ratio
 Binance/Okex/Huobi L/S
 Bitfinex Margin L/S
 ETF Tracker
 Solana ETF
 XRP ETF
 Hong Kong ETF
 Bitcoin Treasuries
 Crypto Reversal
 Ethereum Reserves
 HyperLiquid Wallet Analysis
 Hyperliquid Whale Watch
 Large Transactions
 On-chain Movement
 Bitcoin ROI
 Stablecoin Market Cap
 Options Analysis
 News
News Articles
 Economic Calendar
 Features
 Wallet
 Contract Calculator


 Security
 Collections
 Watchlist
 Following
Cashcat has boarded the cat-themed memocoin wave that swept the entire cryptocurrency space between 2024 and 2025.
The interesting image design, coupled with the fast-growing online community, is basically the origin of its entire story.
It really attracted widespread attention after it landed on the Robinhood chain, during which time it became one of the most hotly debated names on the chain.
Currently,$CASHCAT is priced at US$0.1596, which is after a solid 15.8% increase in a single day. This Cashcat price forecast starts here. Based on this price, all analysis is carried out.
Real-time $CASHCAT Market Data
Indicators| Value
Current Price| $0.1596
24-hour ups and downs| +15.8%
24-hour maximum/minimum| $0.1684 / $0.1378
Market Value| $157787 million
Full dilution valuation| $157787 million
24-hour trading volume| $18.231 million
Circulation Supply| 988.68 million CASHCAT
Maximum supply| Billion CASHCAT
Liquidation snapshot
Coinglass's data presents a rather one-sided picture. In the past 24 hours, approximately $146.55 million of positions have been liquidated, while the short bears have borne almost all of the losses, approximately $145,800, and the long bears have lost only $751.60. 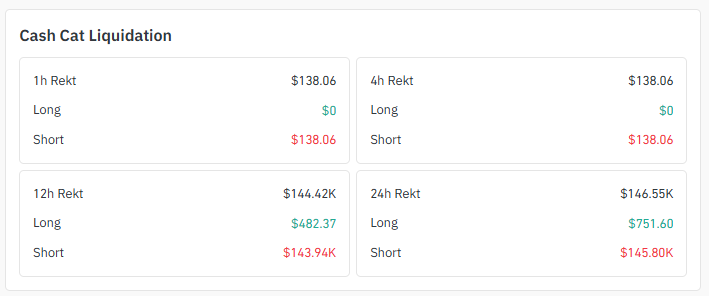
Even zoomed in to the 1-hour and 4-hour time windows, the same pattern appeared. The bears were completely wiped out and the bulls were almost unscathed. This usually means that the rally caught bearish traders off guard.
Exchange trading volume
For $CASHCAT, the derivatives market is the main battlefield. Bybit led the way with $11.08 million in trading volume, followed by Hyperliquid with $8.29 million in trading volume. These two exchanges alone account for most of the trading volume. 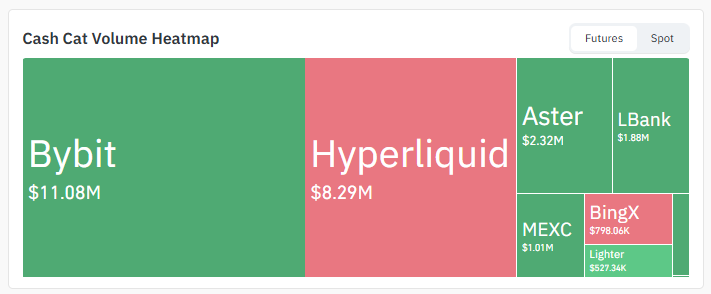
Aster, LBank, MEXC, BingX and Lighter have small trading volumes, but frankly, trading volumes are concentrated on Bybit and Hyperliquid, which already shows where the real money is located.
Cashcat Today's News
Cash Cat has successfully maintained attention on the Robinhood chain and has been a hot topic for several weeks. But attention spans in the cryptocurrency space are usually short. 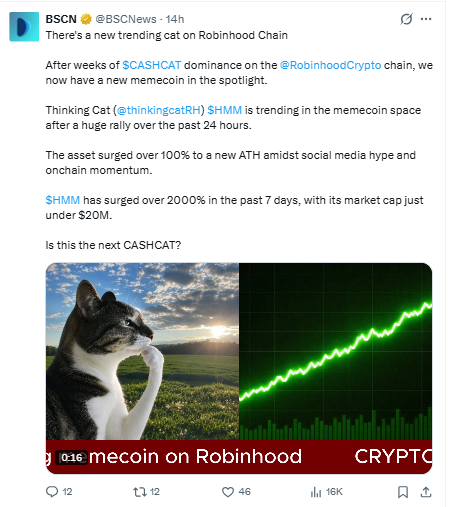
News that an updated cat-themed token has just soared more than 100% to a record high, and people have begun asking if it will become the next CASHCAT. This deserves attention. The rotation of funds into newer narrative themes may draw liquidity from a well-performing token.
Key Points
CASHCAT is currently maintained at around US$0.1596, a one-day increase of more than 15%. Short sellers must be feeling the impact of this trend.
On both the 1-hour and 4-hour time frames, the currency is in a bullish structure and is preparing for a breakthrough. The time for change is coming.
If it can break through US$0.1901 with real trading volume, the price will open up space near the Fibonacci extension of US$0.2514.
However, if the trend line support breaks below, the price will fall to US$0.1188. If the decline intensifies, deeper support is at $0.0924.
Nearly $146,000 of positions have been cleared in the past 24 hours. Shorts absorbed almost all losses.
Technical analysis of Cashcat price forecast: 4-hour chart analysis of $CASHCAT forecast
Zoom in to the 1-hour chart and you can see that $CASHCAT is close to the top edge of a rising triangle. If we can break through this upper edge cleanly, the price will quickly enter the range of $0.1768 to $0.1900. 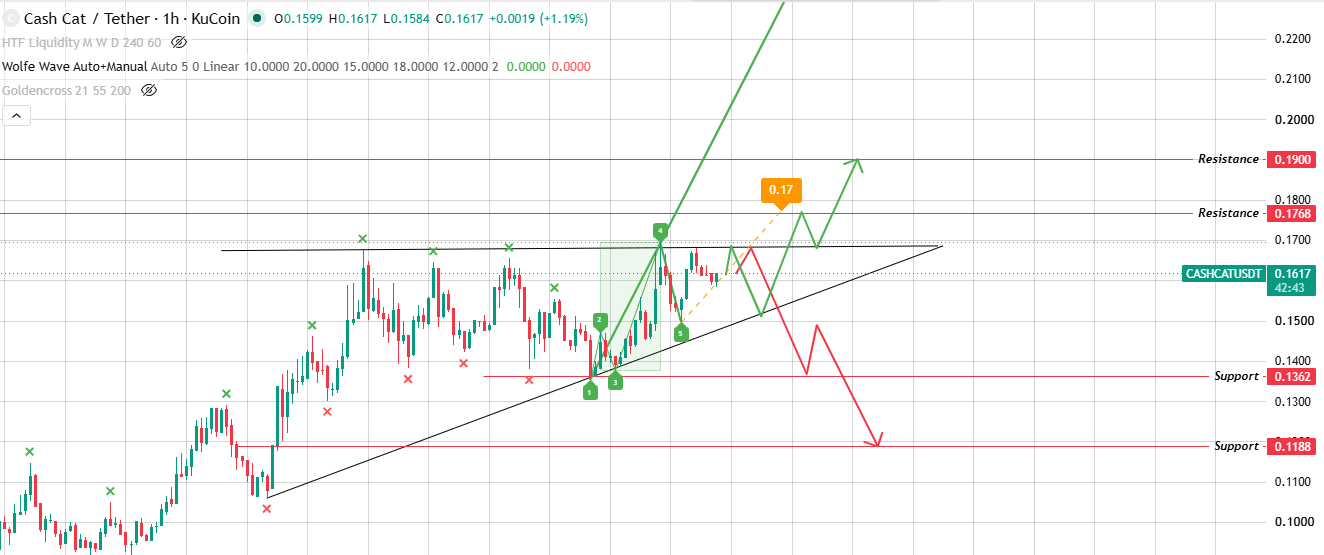
But being rejected here would reverse the situation. A break below the uptrend line would bring it back to $0.1362 and possibly even $0.1188.
$Four-hour chart analysis of CASHCAT predictions
On the four-hour chart, the situation is similar. Prices are testing the upper trajectory of an upward channel. 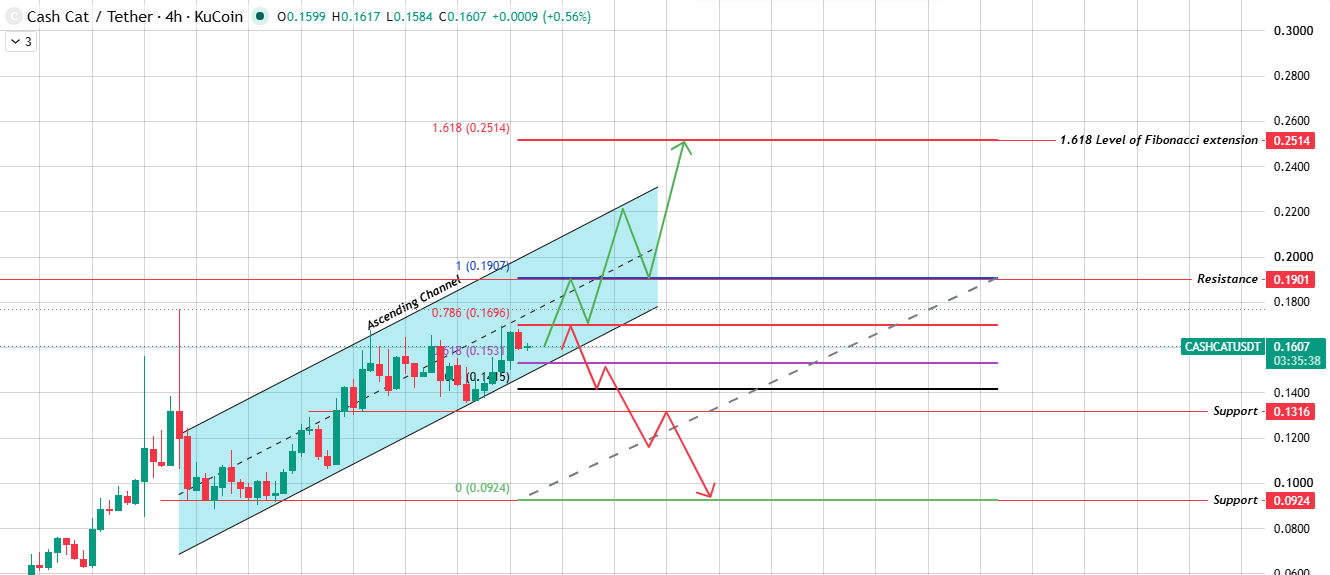
To truly break through US$0.1901, trading volume is needed. If a successful breakthrough is achieved, this position is almost exactly aligned with the 1.618 Fibonacci extension level (approximately $0.2514). If trading volume is insufficient and prices are rejected, the downward trajectory will be tested again. If the downward trajectory is also broken, market momentum will quickly turn bearish.
Two different time frames both build up the same tension near the resistance level.
Bullish, neutral and bearish scenarios
The following three scenarios describe the possible direction of this Cashcat price forecast:
Scenario| Outlook
bullish scenario| The channel resistance level of US$0.1901 was exceeded with strong trading volume. The next target is the 1.618 Fibonacci extension, which is approximately $0.2514.
Neutral case| Prices continue to consolidate sideways between $0.16 and resistance. The range of US$0.1316 to US$0.1362 serves as bottom support.
Bear situation| Both the triangle and channel trend line were broken. Prices fell towards $0.1188, with a deeper decline testing $0.0924.
Glossary
Rising triangle: It is formed when a horizontal resistance line meets a rising support line and is usually a bullish signal.
Ascending channel: Similar to a rising triangle, but both boundary lines slope upward at the same time.
Fibonacci extension: Used to predict the target level that prices may reach after exceeding previous highs or lows.
Liquidation: This occurs when a leveraged transaction is forced to close due to a loss swallowing the margin.
Resistance level: Marks the price area where previous gains have stalled due to selling. Support, on the other hand, is a price area where buying steps in to stop a downtrend.
Methodology
This Cashcat price forecast is based on 1-and 4-hour CASHCAT/USDT chart analysis on TradingView, current market data, Coinglass's clearing data, and exchange trading volume distribution. None of the analysis here goes beyond what the chart actually shows. No extrapolated levels were used.
Disclaimer : This article is for reference only and should not be regarded as financial or investment advice. The cryptocurrency market is extremely volatile, and price forecasts do not guarantee accuracy. Before investing, be sure to research and consult a qualified financial adviser.