Exchange Ranking
 Top Exchanges
 24h Volume Ranking
 Popularity Ranking
 Exchange BTC Balance
 Proof of Reserves
 Decentralized Exchanges
 Funding Rate
 Funding Heatmap
 Liquidation Data
 Max Pain
 Long/Short Ratio
 Whale L/S Ratio
 Binance/Okex/Huobi L/S
 Bitfinex Margin L/S
 ETF Tracker
 Solana ETF
 XRP ETF
 Hong Kong ETF
 Bitcoin Treasuries
 Crypto Reversal
 Ethereum Reserves
 HyperLiquid Wallet Analysis
 Hyperliquid Whale Watch
 Large Transactions
 On-chain Movement
 Bitcoin ROI
 Stablecoin Market Cap
 Options Analysis
 News
News Articles
 Economic Calendar
 Features
 Wallet
 Contract Calculator


 Security
 Collections
 Watchlist
 Following
CashCat Price Prediction: Token is at a Critical Node
This CashCat Price Prediction article was published at a critical moment for the token.$ When CASHCAT was first launched in July 2026, it built its early reputation purely on the popularity of Robinhood Chain. After logging directly into the Robinhood app on August 6, 2026, this momentum returned strongly again.
Currently,$CASHCAT is trading at US$0.1432, down approximately 10.7% in the past 24 hours. The token is consolidating below its recent intraday high of $0.165 and has not clearly broken out in either direction.$ CASHCAT's circulating supply is 988.7 million units, while the maximum supply is 1 billion units, which means there is almost no dilution risk in the future-almost all of the supply has entered the market. As a result, the weight of price movements depends almost entirely on demand and trading flows, rather than new unlocks.
This article aims to analyze where $CASHCAT is in the current context, not just the next target to which the chart points.
$CASHCAT Real-time Market Data
$CASHCAT's current trading price is US$0.1432, down approximately 10.7% during the day. The 24-hour price range is $0.1356 to $0.165. 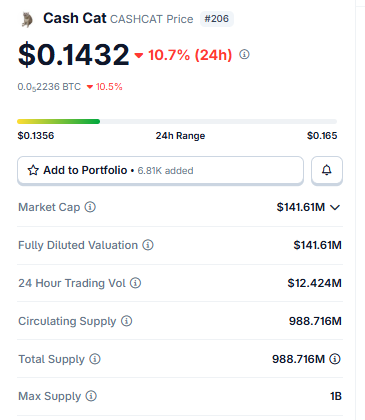
currently has a market value of approximately US$141.61 million, which is in line with its fully diluted valuation, as nearly 988.7 million tokens have been fully circulated. Trading volume in the past 24 hours has been approximately US$12.4 million, and for Meme coins in this market cap range, trading volume is moderate and active.
$CASHCAT Trading Volume Distribution
Hyperliquid led the way in CASHCAT futures trading volume with approximately $9.68 million, followed by Bybit with approximately $8.67 million. 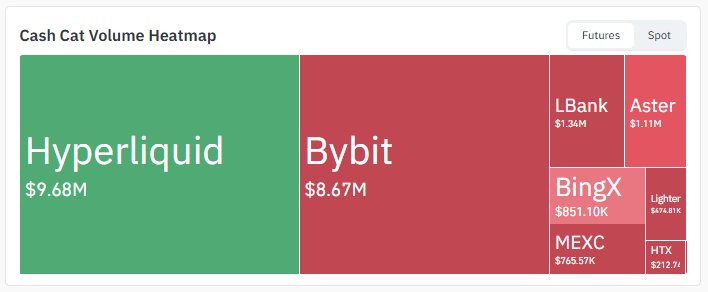 LBank (US$1.34 million) and Aster (US$1.11 million) are next, while BingX (US$851,000), MEXC (US$765,000), Lighter (US$475,000) and HTX (US$212,000) make up the remaining smaller trading platforms. Trading volume is highly concentrated on two exchanges, meaning that a large order on Hyperliquid or Bybit can quickly affect overall market prices. This is worth keeping in mind before over-interpreting any single abnormal K-line.
$CASHCAT Update
This week, online and community trackers have found a significant growth sign: Based on posts tracking token ecosystem activity, the number of $CASHCAT holders has exceeded 57,681 wallets and is still climbing. 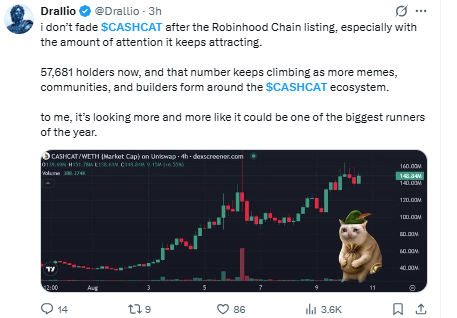 This stable holder growth, coupled with the continued attention of Robinhood Chain after its listing, often reflects the expansion of retail interest, but this in itself does not confirm the next breakthrough direction for the price. Community sentiment has remained largely bullish since its listing, with some views describing $CASHCAT as one of the better performing Meme coins so far this year. If the levels of the charts below match, this narrative drive could support bullish CashCat price forecasts.
Core Points
- $CASHCAT was trading at around US$0.1432, down from a high of US$0.165 and down 10.7% in the past 24 hours.
- On the 4-hour chart, prices remain in the rising channel, and a breakthrough of $0.1650 will open up space for a hit of $0.1900.
- The daily chart shows that the price is right around the 50% Fibonacci retracement level (approximately US$0.1397).
- Compared with the magnitude of recent price fluctuations, the trading volume heat chart shows that trading volume is still low.
- Since the launch of Robinhood Chain, the number of holders has exceeded 57,681 and continues to climb.
$CASHCAT Technical Analysis
CashCat Price Forecast: 4-hour Chart Analysis
The 4-hour Chart shows that $CASHCAT is in a clear rising channel, and the current trading price is approximately US$0.1448. 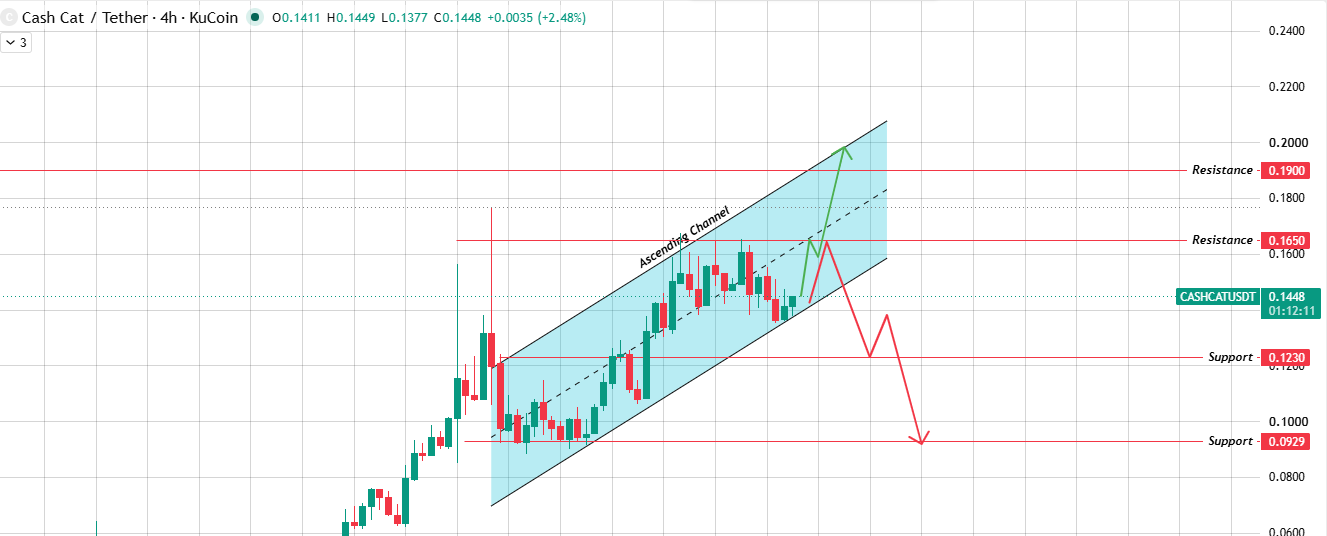 If prices break through and settle above the channel supply area, the next resistance level is $0.1650, followed by $0.1900. Conversely, if the price falls below the lower boundary of the channel, the support level is $0.1230, and the next support level is $0.0929.
CashCat Price Forecast: Daily Chart Analysis
On the daily chart,$CASHCAT is trading right near the 50% Fibonacci retracement level (approximately US$0.1397), which is calculated from a post-launch low (US$0.0894) to a recent local high (US$0.1900). 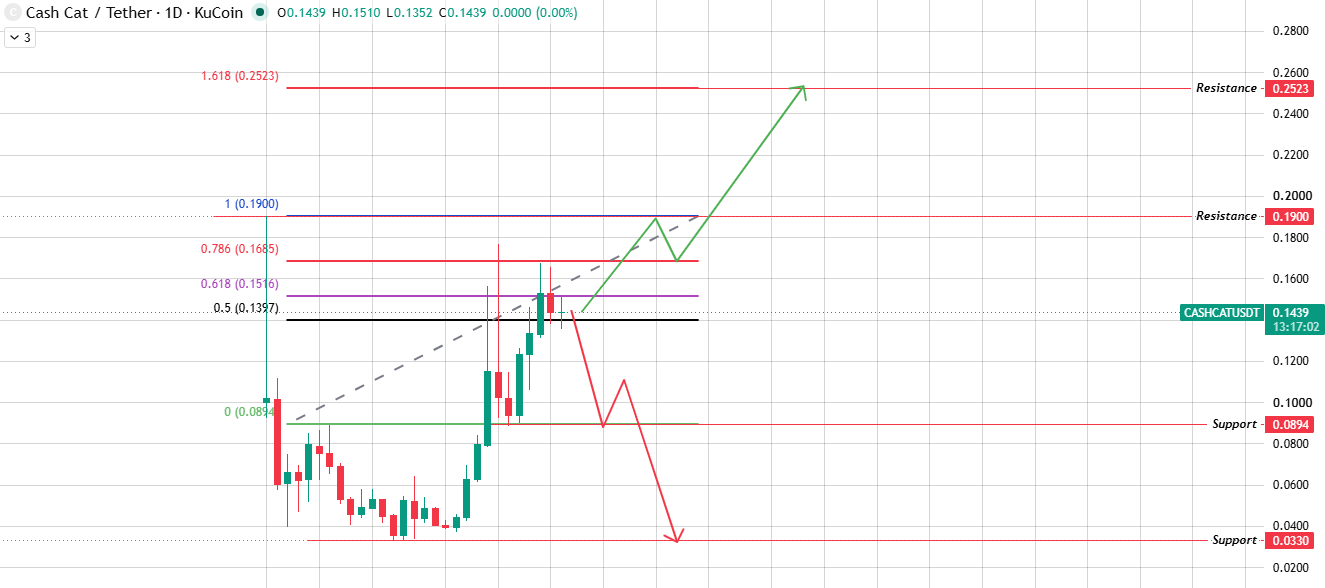 A daily close above the 61.8% Fibonacci level ($0.1516) would strengthen the bullish case, pushing the price test at $0.1685, then $0.1900-a level very close to the token's previous high. A breakthrough of US$0.1900 will open up space for a hit at the 161.8% expansion level (approximately US$0.2523). If the price turns below $0.0894, the next support range is around $0.0330. Both time frames point to the same conclusion: $CASHCAT is at a decision point, and the next volume-supported trend is likely to determine the tone in the coming weeks.
Call/Neutral/Bear Scenario
- Bullish scenario: The trigger condition is that the price breaks through US$0.1650 (4-hour chart) or US$0.1516 (daily chart) with volume coordination. Target range: $0.1650-$0.1900.
- Neutral scenario: The trigger condition is that the price remains between US$0.1230 and US$0.1650. Trend expectations: Horizontal consolidation.
- Bear scenario: The trigger is if the price breaks below $0.1230 (4-hour chart) or $0.0894 (daily chart). Target range: $0.0929-$0.0330.
Glossary
- Rising channel: Prices rebound between two upward sloping trend lines, where prices rise until they break through one side.
- Fibonacci pullback: A set of levels derived from previous price movements and used to assess potential support or resistance during a correction or rebound.
- Strong Equalization: When a trader is short of margin, the exchange forces his leveraged position to close out.
- Open interest: The total value of open futures/derivatives contracts that have not yet been settled or closed.
- Support Area: The bottom area of the price where buying pressure has historically intervened.
- Resistance level: The area at the top of the price where selling pressure has historically limited price upward.
Methodology
The levels used in this CashCat price forecast come directly from chart data over the 4-hour and daily time frames. Strong flat, open interest contracts and volume data are referenced from futures tracking sources. All price levels are extrapolated within the range shown in the chart.