Exchange Ranking
 Top Exchanges
 24h Volume Ranking
 Popularity Ranking
 Exchange BTC Balance
 Proof of Reserves
 Decentralized Exchanges
 Funding Rate
 Funding Heatmap
 Liquidation Data
 Max Pain
 Long/Short Ratio
 Whale L/S Ratio
 Binance/Okex/Huobi L/S
 Bitfinex Margin L/S
 ETF Tracker
 Solana ETF
 XRP ETF
 Hong Kong ETF
 Bitcoin Treasuries
 Crypto Reversal
 Ethereum Reserves
 HyperLiquid Wallet Analysis
 Hyperliquid Whale Watch
 Large Transactions
 On-chain Movement
 Bitcoin ROI
 Stablecoin Market Cap
 Options Analysis
 News
News Articles
 Economic Calendar
 Features
 Wallet
 Contract Calculator


 Security
 Collections
 Watchlist
 Following
 BOME
BOME The current BOME trading price is US$0.0007965, up 20.7% today. BOME will be launched in March 2024 on Solana by pseudonym artist Darkfarms, who is known for his Pepe emoticons. The idea is to create a permanent on-chain emoji file, and as expected, the final supply is exactly 69,000,000,420 tokens. In the early days, it surged 3000%, and its market value exceeded US$1 billion in one day. Things are different now: this BOME price forecast actually comes down to whether BOME can finally break through the resistance zone that has suppressed every real rebound for months. Real-time BOME price data: BOME is now quoted at US$0.0007965, an intraday increase of 20.7%. The 24-hour range itself says a lot: $0.000659 to $0.0008935, which is quite volatile for a token that has been rolled sideways for most of the year. 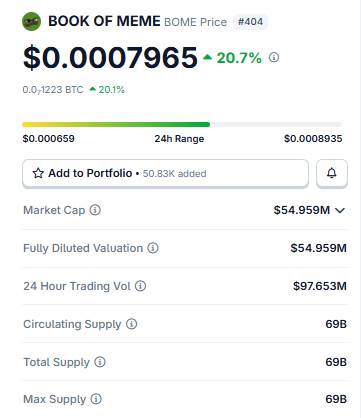 The market value is approximately US$54.959 million. The fully diluted valuation (FDV) is in line with the market value, with no gap because the entire supply of 69 billion units has been in circulation since 2024. No need to worry about unlocking issues. Daily trading volume reached US$97.653 million, much higher than BOME's usual level.
Clearing data and trading volume
US$844,410 was cleared within 24 hours, with short bears taking most of it, reaching US$547,600 and long bears US$296,810. 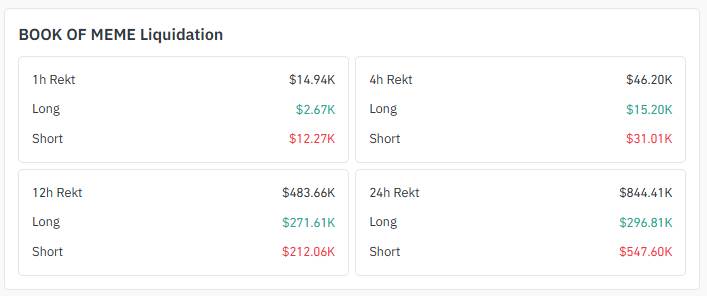 There was a slight change in the 12-hour window, totaling US$483,660, of which the bulls were slightly more this time, at US$271,610. Narrowing to a shorter window, the numbers shrink: $46,200 in 4 hours and $14,940 in 1 hour, both of which are still biased towards short positions.
Two major exchanges dominate trading volume. Binance was US$73.25 million, followed by OKX with US$46.67 million. 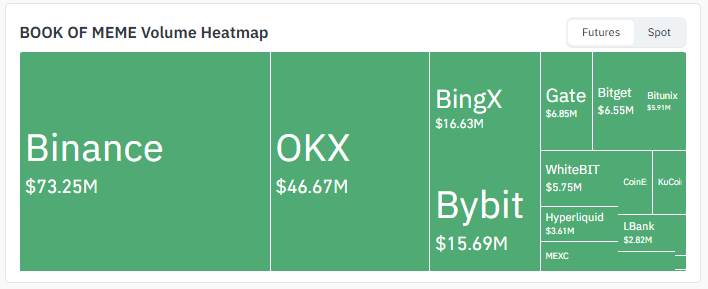 BingX and Bybit are in the US$15 - 17 million range, with the rest of the exchanges (Gate, Bitget, Bitunix, WhiteBIT, Hyperliquid, LBank) sharing the rest.
Key Points
US$0.0007965, up 20.7% today, making it one of BOME's better performing trading days in recent times.
Once again faces the same resistance zone, which has suppressed every real rebound in months.
In the past 24 hours, short bears have borne most of the pressure in the $844,000 liquidation.
Currently, Binance and OKX bear most of the burden in terms of trading volume.
Focus on the 1-hour chart; there is a Wolfe Wave pattern that may be significant if the volume matches.
Technical analysis: What the chart shows
Hour chart analysis
Prices are currently hitting an uptrend line and retreating slightly. 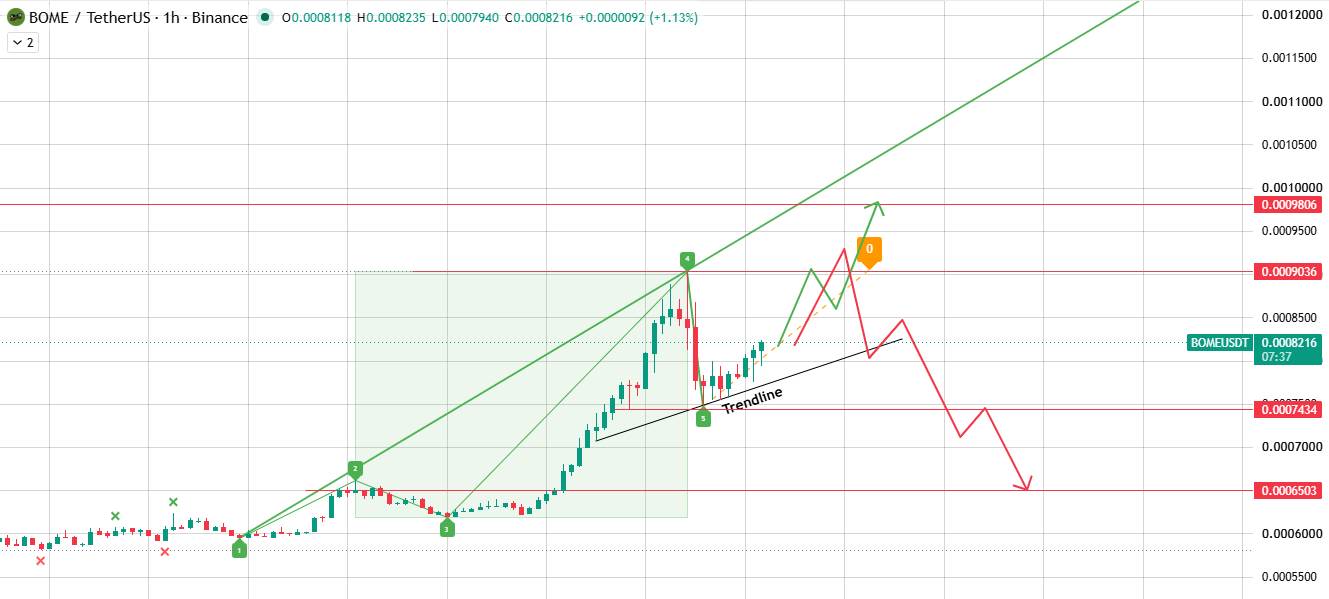 If it exceeds US$0.0009036, it also means that US$0.0009806 is also exceeded, and the price will have room for further upside. If you get stuck here and fall below the trend line, you could fall to support at $0.0007434, followed by $0.0006503. A Wolfe Wave pattern is also formed on the chart. If trading volume increases, prices may move towards the first resistance level.
Daily chart analysis
Looking at the larger picture, BOME is facing an area of resistance that matches the long-term downtrend line. Prices have been blocked here many times. 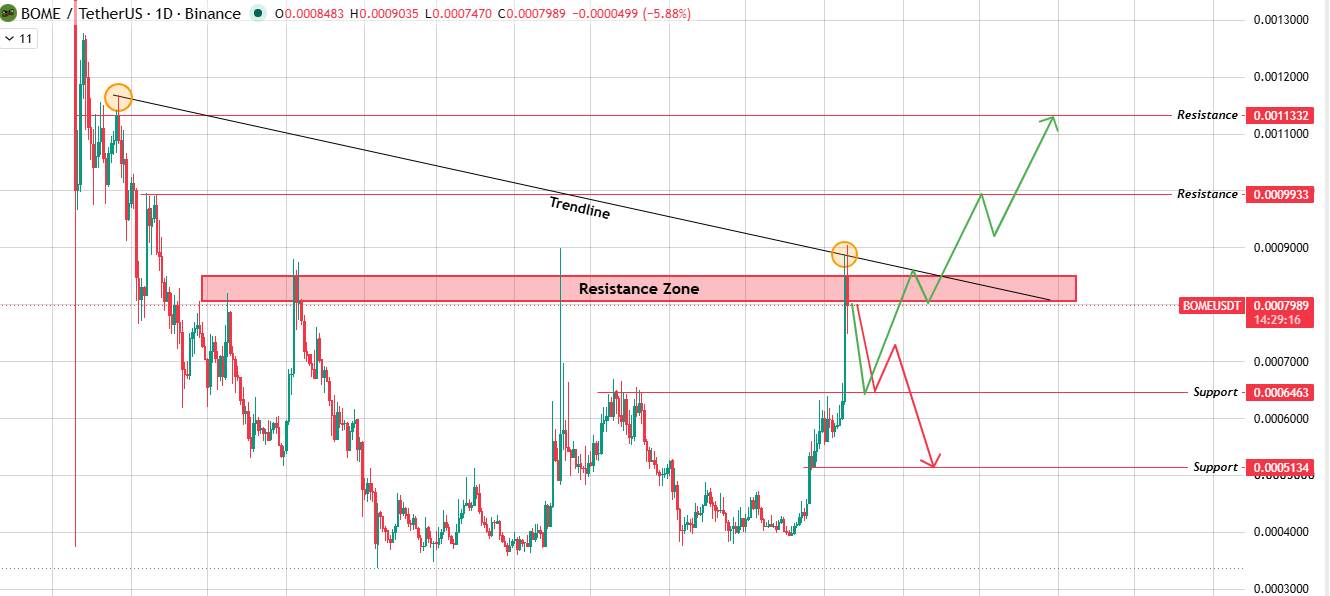 If you break through the region with strong volume, the next target is US$0.0009933, followed by US$0.0011332. If a breakthrough fails, the price is likely to fall back to $0.0006463, with the next support level at $0.0005134.
Bullish, neutral, bearish scenarios
Bullish scenarios
Price level: US$0.0009933-US$0.00111332
Trigger conditions: Break through the daily resistance zone with strong trading volume
Invalid conditions: fall back below US$0.0007434
Neutral scenario
Price level: US$0.0006463-US$0.0007965
Trigger condition: Price swings below the resistance zone
Invalid condition: Persistently close outside either boundary
Bear scenario
Price level: US$0.0006463-US$0.0005134
Trigger condition: Stuck at resistance and break below the uptrend line
Invalid condition: Stand back at US$0.0009933
Expert Opinion
Much of the current discussion around BOME boils down to one question: Does the rally actually have volume to break through a resistance zone that has been in place for months, or does it fade away like all previous attempts? Some traders are optimistic about the Wolfe Wave pattern in the short cycle, believing that if buyers stay engaged, the real breakthrough may go further than usual. Others are not convinced. BOME has made false breakthroughs here many times before, so for anyone seriously weighing this BOME price forecast, the confirmation signal is far more important than the initial push.
Long-term outlook
It comes down to the daily resistance zone, which is simple and clear. If the region is broken through with volume, the broader BOME price forecast will turn significantly bullish, with the target looking at US$0.0011332. If it fails again, BOME is likely to return to its previous volatile range. One thing worth remembering is that given its fair start structure-zero team allocation, no future unlocking-whatever price goes next is purely a result of market sentiment and trading activity, not supply pressure.
Glossary
The resistance zone is not a single line, but an entire price range, that is, the range where selling repeatedly suppresses prices.
Wolfe Wave is a five-wave pattern used by traders to identify potential reversals and is usually confirmed when volume approaches expected levels.
A trend line is a line that connects a series of high or low points, shows the direction of the trend, and can act as support or resistance depending on the direction.
Liquidation is when a trader is unable to bear accumulated losses, the exchange forcibly liquidates his leveraged position.
FDV (fully diluted valuation) is the total supply multiplied by the current price. This is the same as the market value because the entire supply of BOME is already in circulation.
Methodology
This BOME price forecast is based on readings from the TradingView chart over 1-hour and 1-day time frames, combined with Coinglass's clearing and volume data. All support, resistance and trend line levels come directly from the observable chart structure without any extrapolation. Given that BOME has repeatedly made false breakthroughs at similar levels, please view this as an input to broader decision-making rather than an independent signal.
Disclaimer : This article is for reference only and does not constitute financial advice. The cryptocurrency market is highly volatile, and past price performance cannot guarantee future results. Be sure to conduct independent research before making an investment decision.