Exchange Ranking
 Top Exchanges
 24h Volume Ranking
 Popularity Ranking
 Exchange BTC Balance
 Proof of Reserves
 Decentralized Exchanges
 Funding Rate
 Funding Heatmap
 Liquidation Data
 Max Pain
 Long/Short Ratio
 Whale L/S Ratio
 Binance/Okex/Huobi L/S
 Bitfinex Margin L/S
 ETF Tracker
 Solana ETF
 XRP ETF
 Hong Kong ETF
 Bitcoin Treasuries
 Crypto Reversal
 Ethereum Reserves
 HyperLiquid Wallet Analysis
 Hyperliquid Whale Watch
 Large Transactions
 On-chain Movement
 Bitcoin ROI
 Stablecoin Market Cap
 Options Analysis
 News
News Articles
 Economic Calendar
 Features
 Wallet
 Contract Calculator


 Security
 Collections
 Watchlist
 Following
 DOGE
DOGE Dogcoin was first born as a joke in 2013 and was built based on Shiba Inu emoticons, but it has unexpectedly become one of the most lasting projects in the cryptocurrency world. Over the years, it has been at the forefront of market value thanks to its celebrity influence and one of the most loyal communities in the industry. $DOGE currently trades at $0.07035, down about 2% in the past 24 hours. This dogcoin price forecast takes this as a starting point. By analyzing the 1-hour and 4-hour chart structures, we outline the possible shape of the short-term trend.
Real-time market data
Indicator : Current price $0.07035| 24-hour ups and downs-1.8%| 24-hour maximum/minimum $0.07205 / $0.06892| Market Value $10.938B| Fully diluted valuation of $12.043B| 24-hour trading volume $399.376M| Circulation supply 155.474B| Total supply 171.185B
Liquidation summary
In the past 24 hours, approximately US$2.44 million of $DOGE has been liquidated, with long positions accounting for the vast majority of US$2.37 million and short positions only US$69.54 million. 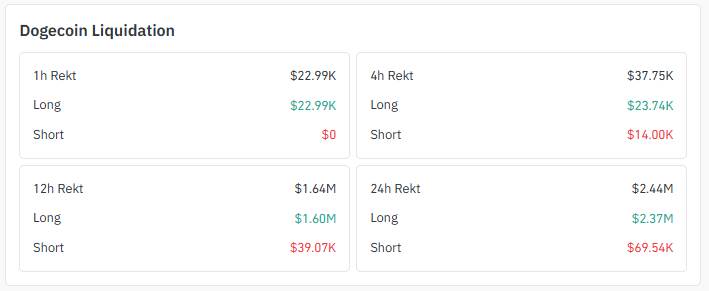
This imbalance also exists in shorter time windows. The one-hour window was completely long liquidation, with an amount of US$22,990; the four-hour window was also biased towards long positions, with US$23.74 million, and the short positions were only US$14,000. The recent weakness in prices has clearly caught long positions more off guard than short positions.
Exchange trading volume
Binance dominates the trading volume of $DOGE derivatives, reaching US$390.65 million, far exceeding other platforms. OKX followed closely with $227.19 million, while MEXC ($98.53 million) and Bybit ($124.15 million) also contributed significant transaction volume. 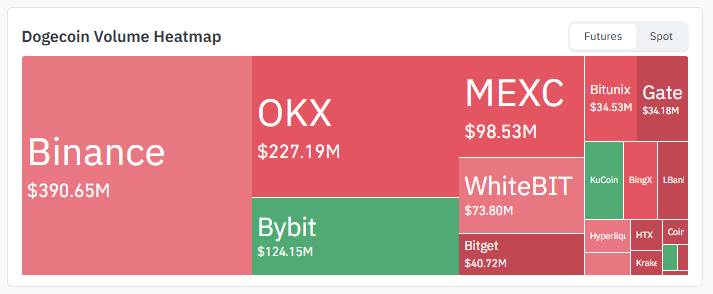 WhiteBIT, Bitget, Bitunix, Gate and several other small exchanges make up the rest. This concentration on Binance and OKX shows that most of the current meaningful positions are concentrated on large platforms.
$DOGE Community Sentiment
Community tracking on the X platform shows that there has been a significant accumulation of whales recently. It is reported that approximately 890 million $DOGE units were purchased in just two days, worth approximately US$62 million. 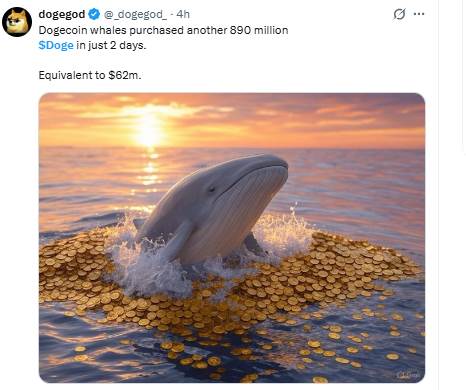 Large-scale accumulation during periods of price declines is often seen as a sign of firm belief among large households, although it does not guarantee an immediate response from prices. If $DOGE tests the lower edge of its current range, it is worth watching whether this buying behavior will continue.
Core Points
Prediction Window: Short-term, next 24-48 hours, based on 1-hour and 4-hour chart structures. DOGE is currently at $0.07035, down 1.8% on the day. Prices have just rebounded from the support area on the 1-hour chart and that level is being tested. On the hourly chart, DOGE trades below the downtrend line. This trend line has been suppressing the momentum of recent surges. The 4-hour chart shows more constructive structures below-an ascending channel that remains intact despite a correction. Breaking through the 1-hour trend line, US$0.07136 is the first target, followed by US$0.07315. If the price falls below the US$0.06871 support area, this view will expire. If it falls below the lower boundary of the 4-hour channel, US$0.06890 will be tested. If selling intensifies, it will be further supported at US$0.06764.
Technical Analysis
1-hour Chart: Trend Line Suppression or Recovery
On the 1-hour chart (Binance, DOGE/USDT), prices are trading below the downtrend line and have just rebounded from support areas. This is a key level that needs attention at present. 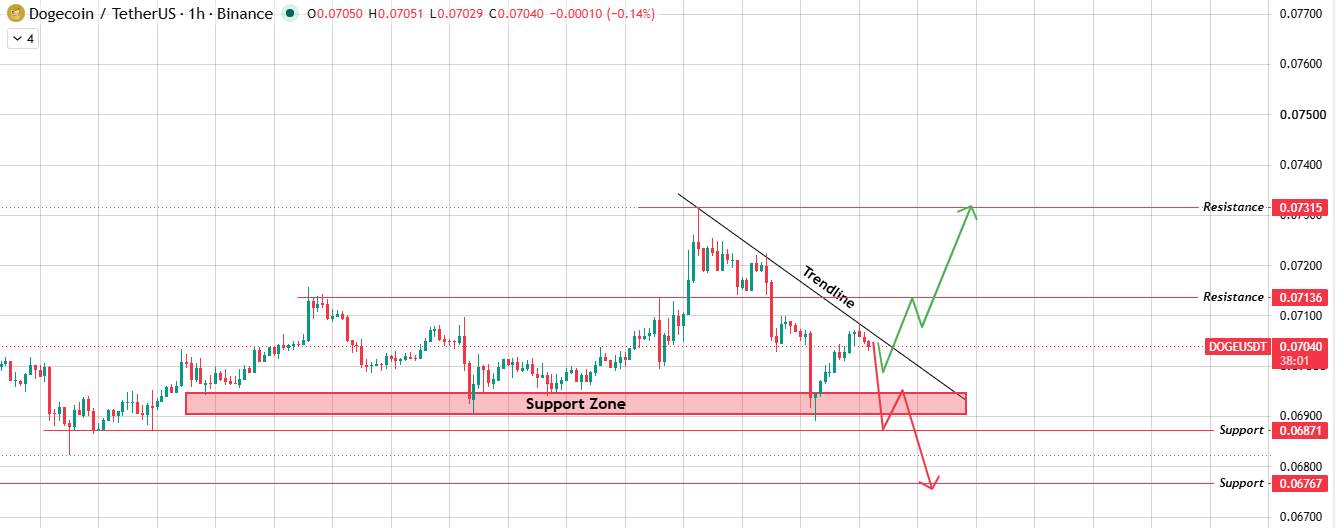 If it can break above the trend line cleanly, US$0.07136 will become the first resistance level. If buyers continue to push, the next target is US$0.07315. However, if it is suppressed again here, a break in the support area will open the door for prices to $0.06767, which could fall further if momentum strengthens.
4-hour chart: The ascending channel is still intact
Zoom in on the field of view to the 4-hour chart, and the structure looks more constructive.$ DOGE has been operating in an upward channel, and prices are currently testing the lower half of the range, near $0.07036. 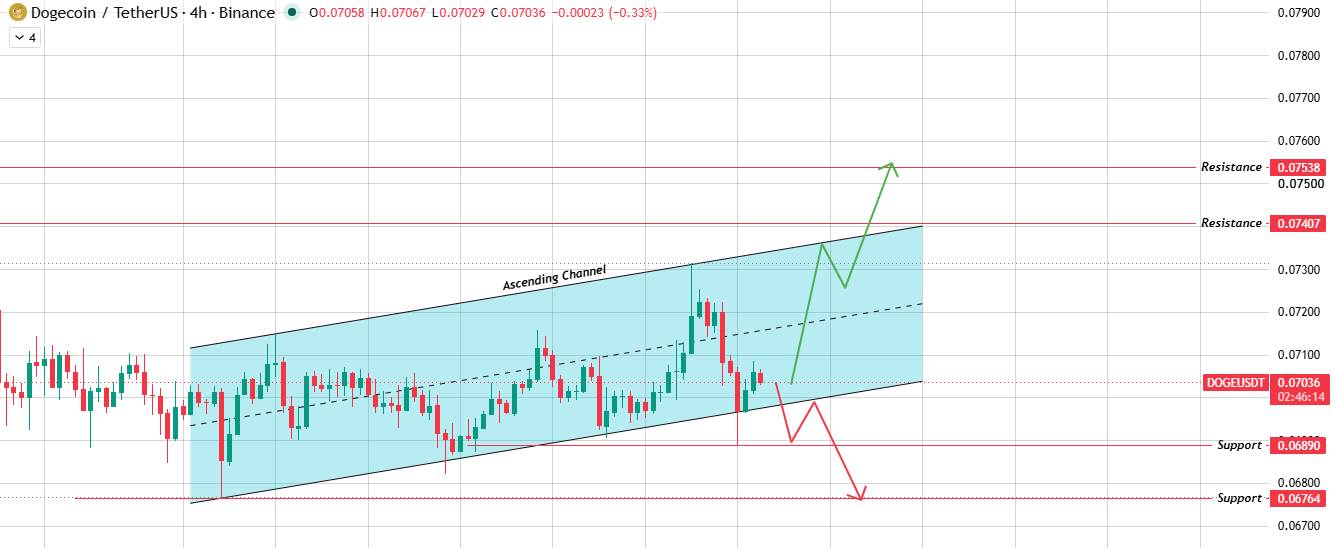 If the upper boundary of the channel is exceeded, US$0.07407 will become the target. If this wave of rise is supported by real trading volume, it may continue to US$0.07538. On the contrary, if it breaks below the lower boundary, it will first gain support around US$0.06890, and the deeper support below it will be US$0.06764. Both charts are currently focusing on roughly the same areas, but from different perspectives. 0.0687-0.0690 The U.S. dollar region is playing a key role.
Bullish, neutral and bearish scenarios
Bullish scenarios: Breaking the 1-hour trend line (approximately US$0.0710 -0.0714) will open the way to US$0.07136, followed by US$0.07315. At the same time, the channel support level remains for 4 hours. Failure conditions: The price closed back below the US$0.06871 support level.
Neutral scenario: $DOGE continues to fluctuate between the US$0.06890 -0.06871 support area and trend line resistance, while the channel remains intact. Failure condition: Confirm that the daily closing price falls outside either boundary.
Bear scenario: blocked at the trend line and fell below the US$0.06871 support area and the bottom of the 4-hour channel, dragging the price towards US$0.06764. Failure condition: Price continues to recover US$0.07136.
Glossary
Downtrend line connects a series of gradually decreasing highs, usually serving as resistance until prices resolutely break through. A rising channel is a price structure that climbs between two parallel, upwardly sloping trend lines. Support area is a price range (rather than a single line) within which buying pressure repeatedly intervenes. Liquidation occurs when a leveraged position is forcibly closed because a loss exceeds the available margin. Whale accumulation refers to the purchase of large amounts of assets by large households and is often seen as a signal of long-term belief.
Methodology
This dogcoin price forecast is based on a 1-hour and 4-hour chart analysis of the coin installation DOGE/USDT (data collected on August 13, 2026), combined with CoinGecko's real-time market data, Coinglass's clearing data and current exchange trading volume distribution. All price levels mentioned are derived directly from the charts provided and no inferences are made beyond the visual range. If $DOGE clearly closes outside the US$0.0677 -0.0741 range, this forecast should be reviewed.