Exchange Ranking
 Top Exchanges
 24h Volume Ranking
 Popularity Ranking
 Exchange BTC Balance
 Proof of Reserves
 Decentralized Exchanges
 Funding Rate
 Funding Heatmap
 Liquidation Data
 Max Pain
 Long/Short Ratio
 Whale L/S Ratio
 Binance/Okex/Huobi L/S
 Bitfinex Margin L/S
 ETF Tracker
 Solana ETF
 XRP ETF
 Hong Kong ETF
 Bitcoin Treasuries
 Crypto Reversal
 Ethereum Reserves
 HyperLiquid Wallet Analysis
 Hyperliquid Whale Watch
 Large Transactions
 On-chain Movement
 Bitcoin ROI
 Stablecoin Market Cap
 Options Analysis
 News
News Articles
 Economic Calendar
 Features
 Wallet
 Contract Calculator


 Security
 Collections
 Watchlist
 Following
 SHIB
SHIB Shiba Inu Coin (SHIB) Price Forecast: Shock consolidation, direction choice is imminent
Shiba Inu Coin was launched in 2020. It self-proclaimed as a "dogcoin killer", and its memetic energy has made it develop into one of the largest communities in the entire cryptocurrency field. Over the years, it remains one of the most well-known tokens in the industry, known for its huge supply, token destruction mechanism and sharp price fluctuations. Currently, the SHIB price is US$0.0000447 and has remained almost unchanged in the past 24 hours. Based on this, the price forecast in this article analyzes the possible trend if prices break through or fall below the current range.
Real-time market data for Shiba Inu coins
Indicator: Current price, value: 0.0000447 US $
Indicator: 24-hour rise and fall, value: +0.1%
Indicator: 24-hour high/low price, value: 0.0000451 US$0.0000437
Indicator: Market value, value: US$2.637 billion
Indicator: Fully diluted valuation, value: US$4.476 billion
Indicator: 24-hour trading volume, value: US$58.051 million
Indicator: Circulation supply, value: 589.24 trillion SHIB
Indicator: Total supply, value: 589.496 trillion SHIB
Data source: SHIB market value data is obtained from Coingecko, as of August 13, 2026. Data from different tracking sites may vary slightly.
Liquidation snapshot
Coinglass data shows that the total liquidation amount in the past 24 hours was US$79,010, of which long liquidations dominated, approximately US$74,930, and short liquidations were only US$4,090. 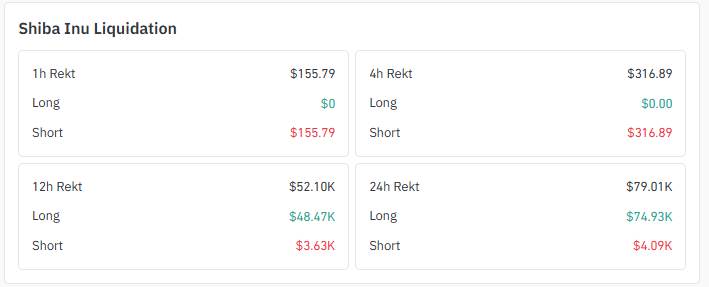
However, this situation is different from data for shorter time windows. The one-hour and four-hour clearing is almost all in the short direction. The signals are mixed and deserve close attention to observe the subsequent development of the trend line test.
Exchange trading volume
OKX currently leads the way in SHIB trading volume, reaching US$12.02 million, far exceeding other exchanges. LBank followed closely with US$6.57 million, while MEXC and Bitget were about US$4 million to US$4.6 million respectively. 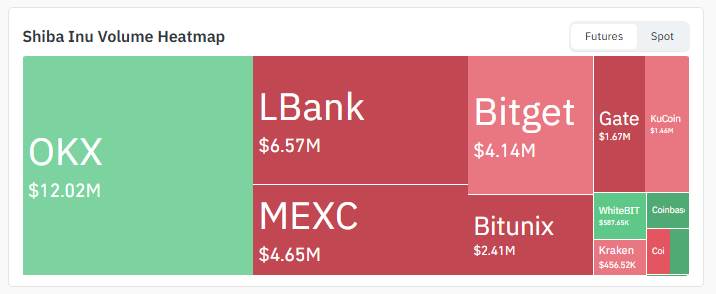
Gate, KuCoin, WhiteBIT, Kraken and Coinbase account for smaller shares. Trading volume is spread across many exchanges, often indicating broad and stable market interest rather than concentration in a single corner.
Today's News of Shiba Inu Coin
The destruction mechanism of the Shiba Inu Coin ecosystem has continued to be active recently. Reports show that nearly 1.8 million SHIB coins were destroyed in 24 hours in a single day. 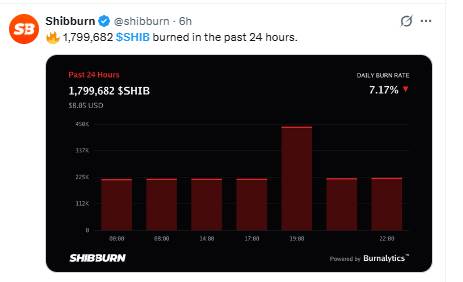
However, the destruction rate has dropped by about 7% from the previous day and has not accelerated at present. Considering the huge supply of SHIB, destruction alone is difficult to have a substantial impact on prices, but during periods of sideways price fluctuations, continued destruction activities do reflect the maintenance of community participation.
Key Points
The current trading price of SHIB is approximately US$0.0000447, with a slight increase during the day. There have been no drastic fluctuations, but the market landscape seems tense.
On the 4-hour chart, prices are limited to a downtrend line. This trend line has continued to suppress every rebound.
The daily chart also shows a larger movement, with the SHIB located near the tip of a descending wedge.
If we break through the wedge shape and trend line upwards, US$0.0000499 will become the target, and it can be seen further as US$0.0000583.
If a breakthrough fails, support will move down to US$0.0000405, with a deeper Fibonacci level at US$0.0000295.
Technical analysis of Shiba Inu price forecast
SHIB price forecast: 4-hour chart analysis
The 4-hour chart shows that SHIB is suppressed by a downtrend line, and every upswing is rejected by this trend line. 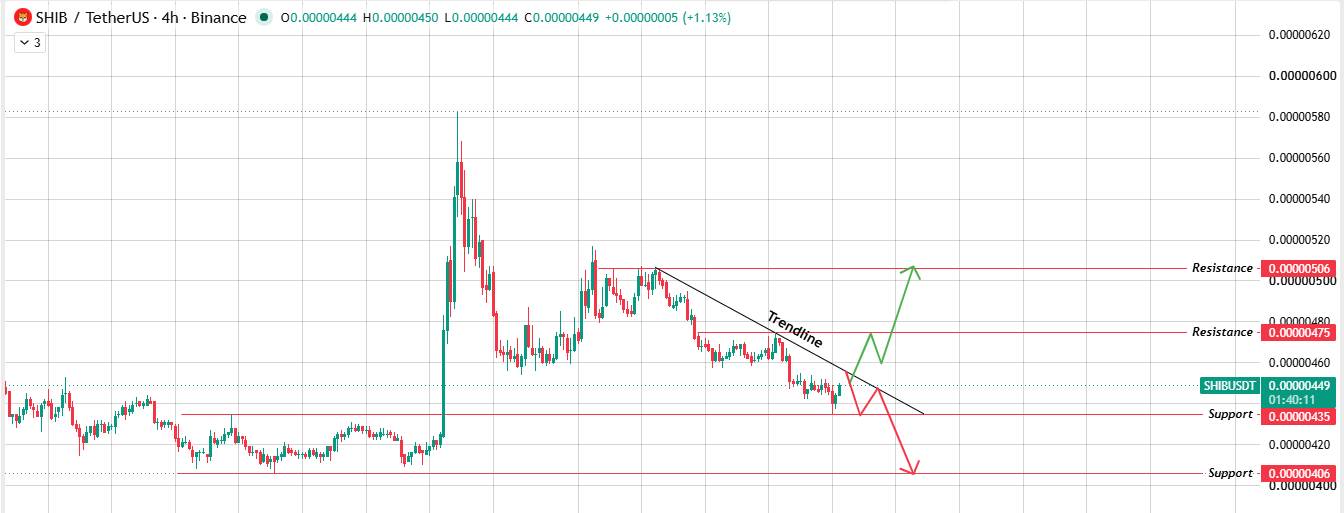
If you break through this trend line cleanly, look at US$0.0000475 first, followed by US$0.0000506. However, if the rebound is rejected and the US$0.0000435 support falls, the price is likely to fall towards US$0.0000406.
SHIB Price Forecast: Daily Chart Analysis
The situation becomes more interesting by lengthening the time frame to the daily line. The SHIB is at the tip of a descending wedge that has been compressed for some time and usually signals violent fluctuations that will follow. 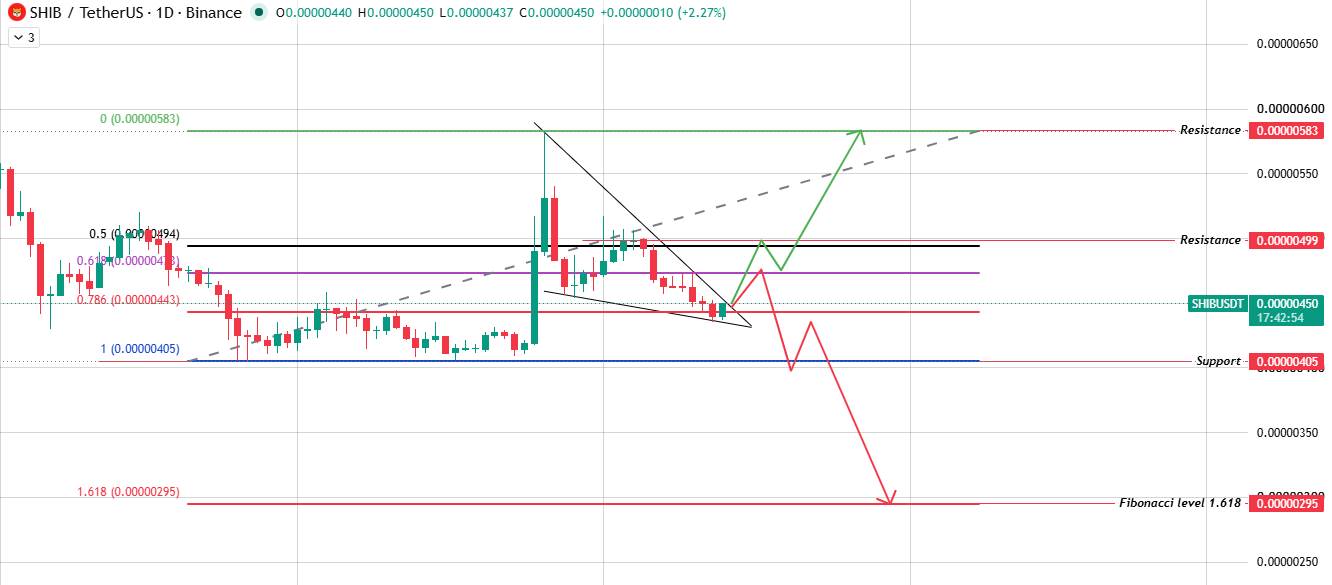
If the upper boundary is exceeded, US$0.0000499 constitutes a direct resistance level; if buyers intervene strongly, the more important resistance level is US$0.00000583. On the contrary, if the lower boundary falls below, the support level near US$0.0000405 will quickly be tested; if selling pressure intensifies, the price may fall sharply to the 1.618 Fibonacci level of US$0.0000295.
Both charts point to the same conclusion: SHIB is ready to go, and the direction of breakthrough of the trend line will determine the future trend.
Bullish, neutral and bearish scenarios
The following three paths show the possible direction of this Shiba Inu price forecast:
Scenario: Bullish. Outlook: Both trend line and wedge resistance levels have broken through. The price first climbs to US$0.0000499, and if momentum continues, it will look further towards US$0.0000583.
Scenario: Neutral. Outlook: SHIB continues to fluctuate near the tip of the wedge, consolidating between US$0.0000435 and US$0.0000475, while the wedge pattern further tightens.
Scenario: Bear. Outlook: The trend line rejection caused prices to fall below support to $0.0000405, with deeper Fibonacci support at $0.0000295.
Glossary
Downtrend line: Connects a series of gradually lower highs and usually constitutes resistance before being breached.
Downward wedge: A price pattern in which prices compress between two downwardly sloping and gradually converging trend lines, usually ending in a bullish breakout.
Fibonacci level: A mathematically derived price region used to predict potential support or resistance levels.
Liquidation: When the loss of a leveraged position exceeds the available margin, the position is forcibly closed.
Token destruction: Permanently removes tokens from circulation supply. Circulation supply refers to the number of tokens currently available for trading and use.
Methodology
This Shiba Inu coin price forecast is based on the ShibusDT 4-hour and daily chart analysis of Binhang's SHIBUSDT, combined with real-time market data, Coinglass clearing data, exchange trading volume distribution and recent destruction rate data. All price levels are directly derived from the charts provided and no inferences are made beyond the ranges shown.