Exchange Ranking
 Top Exchanges
 24h Volume Ranking
 Popularity Ranking
 Exchange BTC Balance
 Proof of Reserves
 Decentralized Exchanges
 Funding Rate
 Funding Heatmap
 Liquidation Data
 Max Pain
 Long/Short Ratio
 Whale L/S Ratio
 Binance/Okex/Huobi L/S
 Bitfinex Margin L/S
 ETF Tracker
 Solana ETF
 XRP ETF
 Hong Kong ETF
 Bitcoin Treasuries
 Crypto Reversal
 Ethereum Reserves
 HyperLiquid Wallet Analysis
 Hyperliquid Whale Watch
 Large Transactions
 On-chain Movement
 Bitcoin ROI
 Stablecoin Market Cap
 Options Analysis
 News
News Articles
 Economic Calendar
 Features
 Wallet
 Contract Calculator


 Security
 Collections
 Watchlist
 Following
 SHIB
SHIB Shiba Inu was launched in 2020 and calls itself the "dogcoin killer". At its core is a huge supply of tokens and a community that is growing far faster than most people expected for a currency that initially had no practical use. Since then, it has added actual infrastructure, such as the Shibarium Layer 2 network, and an ongoing token destruction mechanism aimed at gradually reducing its huge supply.
In this Shiba Inu price forecast,$SHIB is currently trading at US$0.0000446, down 0.5% in the past 24 hours, fluctuating within a narrow range of US$0.000044 to US$0.000045.
$SHIB real-time market data
Before entering the specific direction of this Shiba Inu price forecast, the following is the current market overview of SHIB. The data comes directly from real-time information rather than delayed data sources.
Indicator value
Price 0.0000446 US$
24-hour change-0.5%[@G_19]
24-hour range US$0.000044-US$0.000045
Market cap 2.63 billion
23]
Fully diluted valuation of US$4.463 billion
24-hour trading volume of US$48.054 million
Circulation supply 58 9.24 trillion SHIB
Total supply 589.496 trillion SHIB
Source:$SHIB market value data is taken from Coingecko, as of August 14, 2026. Data from other tracking sites may differ slightly.
Liquidation snapshot
Clearing activity on $SHIB remained relatively balanced over the past day, which contrasts with the extreme imbalance that typically appears when markets experience strong unilateral movements. The total amount of 24-hour liquidation was US$19.36 million, of which US$17.96 million was cleared for long positions and US$1,400 was cleared for short positions. There was a certain bias but not extreme situation. 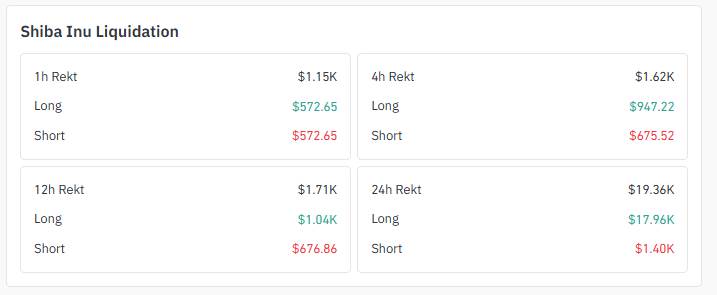 Source: Liquidation data is taken from Coinglass.
The shorter time window also shows some interesting phenomena. Within the one-hour window, the clearing amounts of both long and short parties were exactly equal, both at US$572.65, which indicates that at this moment, neither long nor short positions have been able to clearly control momentum.
Exchange trading volume
SHIB's 24-hour trading volume was US$48.054 million, with OKX leading the way with US$10.12 million, followed by LBank's US$4.75 million and MEXC's US$3.2 million. 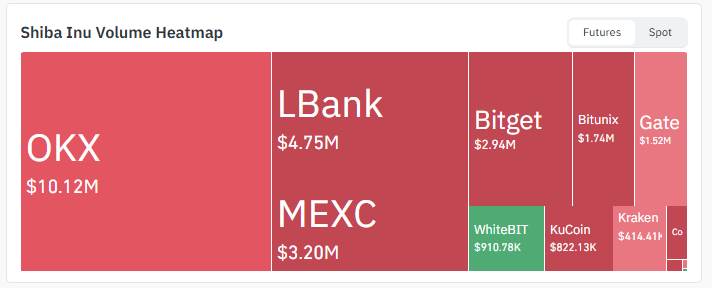 Source: Trading volume heat map data is taken from Coinglass.
Bitget, Bitunix and Gate followed closely, with transaction volumes ranging from $1.5 million to $3 million, while WhiteBIT, KuCoin and Kraken each had less than $1 million. Wide distribution of trading volume, rather than concentration on a few or two exchanges, usually means that price discovery is more stable and less susceptible to manipulation.
Destruction and marketing activities
The $SHIB destruction mechanism has been in full operation recently. In just 24 hours, more than 11.1 million coins have been removed from circulation, and the daily destruction rate is said to have soared by more than 518.68% compared with the typical level. Source: Data from @shibburn (X platform account). 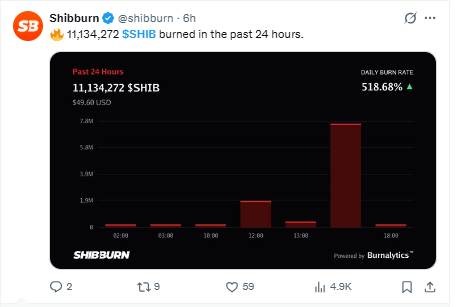
Another market comment this week also pointed out that the surge in activity on the Shiba Inu Exchange may indicate that the $SHIB is planning a rebound rather than continuing to decline. Source: Data from @Utoday_en (X platform account). 
These two factors by themselves do not guarantee that prices will respond, but they do provide context for understanding why the current channel test is more important than ever in this Shiba Inu price forecast.
Key Points
The current trading price of Shiba Inu is US$0.00000446, down 0.5% in the past 24 hours.
The 4-hour chart shows that the SHIB is in the descent channel and close to the lower rail area.
More than 11.1 million SHIBs were destroyed in 24 hours, and the destruction rate increased by more than 500%.
The 24-hour clearing is relatively balanced at US$19.36 million, which is different from a typical unilateral market.
OKX leads with $10.12 million in 24-hour trading volume totaling $48.054 million.
Technical Analysis of Shiba Inu Price Forecast
The 4-hour chart shows that $SHIB is trapped in a downward channel, with each rebound high since the last surge being lower than the previous one, a pattern that usually suggests that sellers still have control even during the rebound. 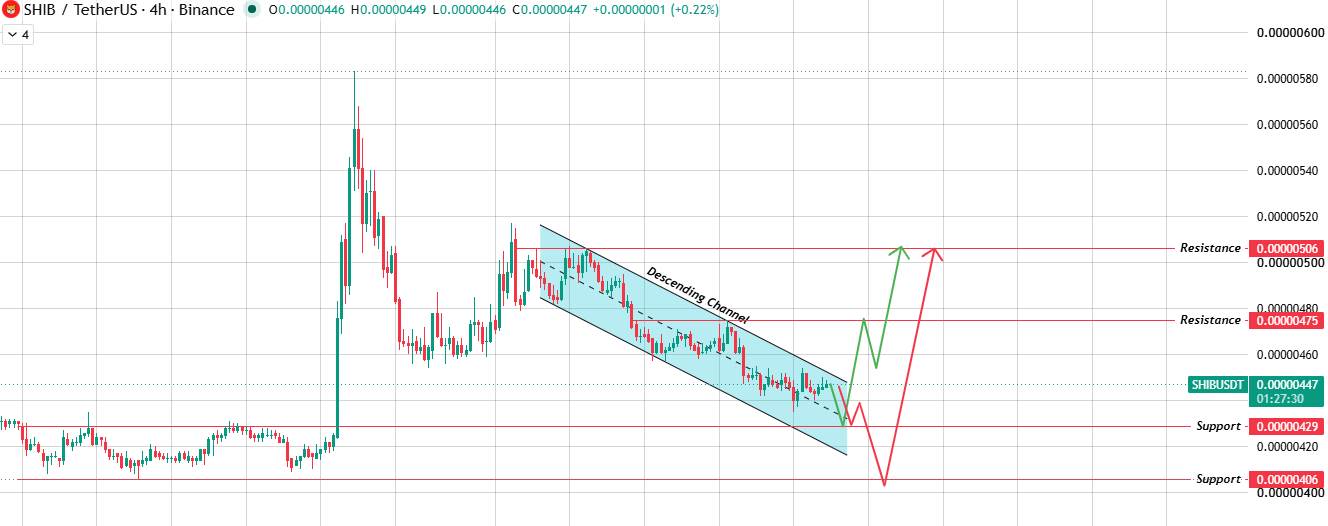 Source: Chart taken from TradingView.
Current prices are trading near the upper boundary of the channel. If the upper boundary of the channel is exceeded with the support of trading volume, it is expected to open the door to US$0.0000475, and the next target is US$0.0000506. Conversely, if resistance falls back here, it is more likely to slide towards support, with the first support level at US$0.0000429, and if selling intensifies, the lower support level at US$0.0000406. At present, for this Shiba Inu price forecast, the entire channel is the entire story. Until SHIB truly breaks through one side of the channel with clear confidence, nothing will have a substantive result.
Bullish, neutral, and bearish scenarios
This Shiba Inu price forecast depends almost entirely on which side of the four-hour downtrend channel is breached first, and whether the recent surge in destruction is ultimately reflected in prices. Both scenarios are possible until one side of the channel is truly broken through with the cooperation of trading volume.
Bullish scenario: price target of US$0.0000475-US$0.0000506, provided that the upper boundary of the 4-hour downtrend channel is exceeded with volume support, and an expiration condition is blocked at US$0.00000475 and falls back to the channel to close.
Neutral scenario: Price range 0.0000429 - 0.0000475, provided that the price remains fluctuating within the channel and no decisive breakthrough occurs, and the failure condition is that the closing price breaks through either side of the channel.
Bear scenario: price target 0.0000429 - 0.0000406, provided that it breaks below the lower boundary of the channel, and as volume increases, the failure condition is to regain US$0.0000429 supported by volume.
Glossary
Downward channel: A price structure in which each high and low point decreases in turn, framed by two downwardly sloping parallel lines. Resistance level: The price area where selling pressure has historically intervened and prevented price increases. Support area: A price area where buyers have stepped in many times to accommodate falling prices. Token destruction: Permanently removes tokens from circulation supply, usually sent to an address that no one can access. Liquidation: Leveraged positions are forcibly closed when losses consume the trader's margin.
Methodology
This Shiba Inu price forecast is based on a 4-hour chart analysis submitted for review and cross-verified with real-time market data, exchange volume distribution, clearing data, and recent destruction and market activity reports. No extrapolation is made about price levels that do not appear in the source chart.
Disclaimer : This document is for information purposes only and does not constitute financial advice. The cryptocurrency market is extremely volatile, and past chart models cannot guarantee future results. Be sure to research and consult a licensed financial adviser before making an investment decision.