Exchange Ranking
 Top Exchanges
 24h Volume Ranking
 Popularity Ranking
 Exchange BTC Balance
 Proof of Reserves
 Decentralized Exchanges
 Funding Rate
 Funding Heatmap
 Liquidation Data
 Max Pain
 Long/Short Ratio
 Whale L/S Ratio
 Binance/Okex/Huobi L/S
 Bitfinex Margin L/S
 ETF Tracker
 Solana ETF
 XRP ETF
 Hong Kong ETF
 Bitcoin Treasuries
 Crypto Reversal
 Ethereum Reserves
 HyperLiquid Wallet Analysis
 Hyperliquid Whale Watch
 Large Transactions
 On-chain Movement
 Bitcoin ROI
 Stablecoin Market Cap
 Options Analysis
 News
News Articles
 Economic Calendar
 Features
 Wallet
 Contract Calculator


 Security
 Collections
 Watchlist
 Following
 PUMP
PUMP PUMP breaks through higher, but confirmation signal still remains
Price forecast observers at Pump.fun are facing a truly open landscape this week. The trading price of the token is slightly above the upper track of its daily rising channel, a position that has never been effectively stabilized before.
The current price is around $0.002953 and has risen sharply over the past month, and the chart now raises a simple question: Will this breakthrough stand firm or will it fall back into the range it just exited? A breakthrough attempt is not the same as a successful breakthrough, and this difference is the entire key to the current market.
Why is PUMP rising at this time?
There are no major new catalysts on the horizon, so this rally seems to be driven mainly by momentum and position structure rather than a single headline. Tokens have risen nearly 95% in the past month and more than 23% in the past week, a trend that often has a self-reinforcing effect. During the rally, short positions were squeezed out, while the rise in open interest signals that new leveraged funds were entering, pushing prices into areas unseen in previous months.
What does the PUMP derivative data reveal?
The total liquidation amount in the past 24 hours was approximately US$917.51 million, of which approximately US$703.61 million was cleared for short positions and approximately US$213.89 million was cleared for long positions. 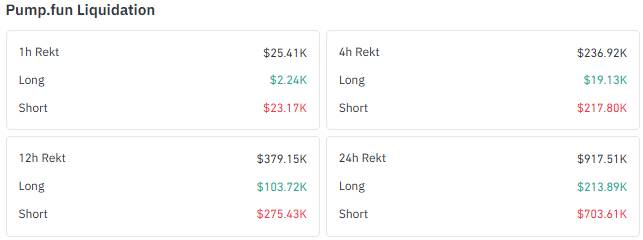 This imbalance is equally evident in shorter time windows, with 4-and 12-hour data showing that short liquidations dominate. This pattern suggests that the current market is more like a short squeeze than a signal confirming that there is still room for growth.
 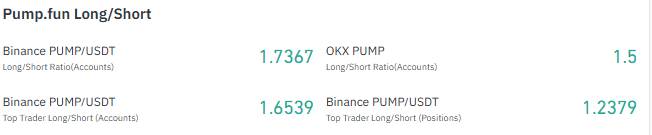 The tendency to hold positions also points in the same direction. Binance's account long-short ratio is about 1.74, top-level trading accounts are close to 1.65, and OKX accounts also show a similar bullish trend, at about 1.5.
 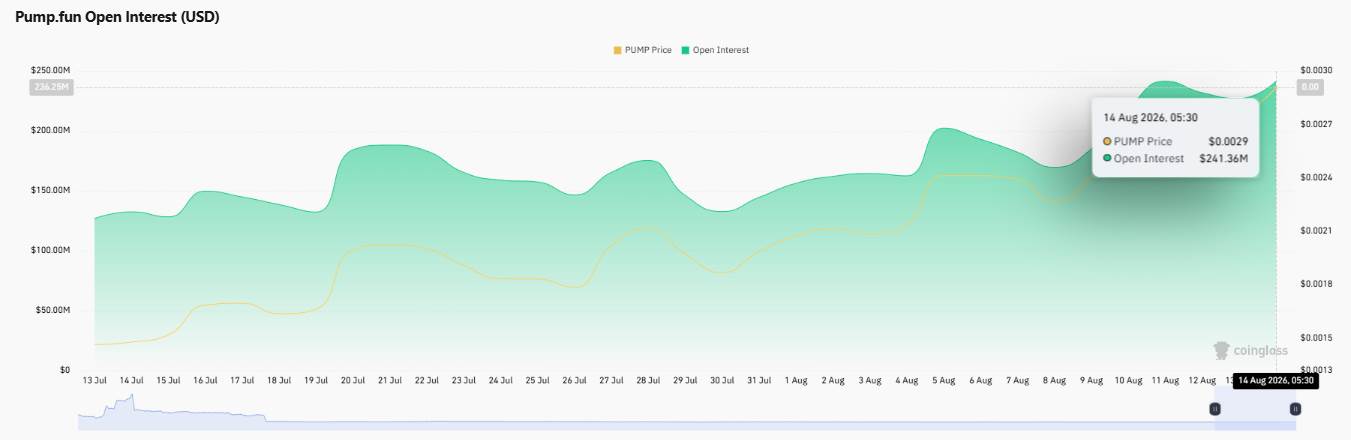 Open interest climbed to approximately $241.36 million with the rally, which means that a considerable amount of leveraged funds has accumulated behind a token trading at close to $0.0029. A rise in open interest does not automatically mean bullish. It mainly indicates that both leveraged funds are active, which increases the probability of more violent fluctuations once the market chooses a direction.
How has PUMP performed recently?
The token has gained approximately 7.2% in the past 24 hours, 23.15% in the past week, and 94.42% in the past month-a trend that explains why the chart is testing new resistance levels. 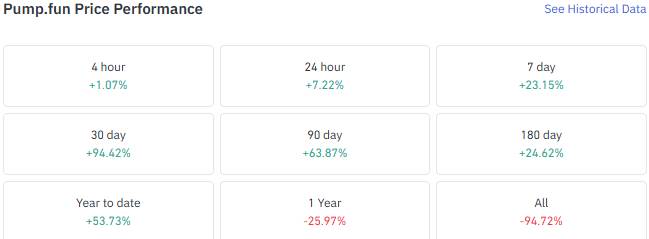 Lengthen the time, with a year-to-date increase of 53.73%, but the one-year change still fell by nearly 26%. The market value has grown to approximately US$1.15 billion, with 24-hour trading volume approaching US$115.54 million, up nearly 29% from the day.
Can PUMP stand firm on the daily rising channel?
The daily chart shows that PUMP has formed a rising channel since its rebound in July, and prices are currently trying to break through the upper channel for the first time. 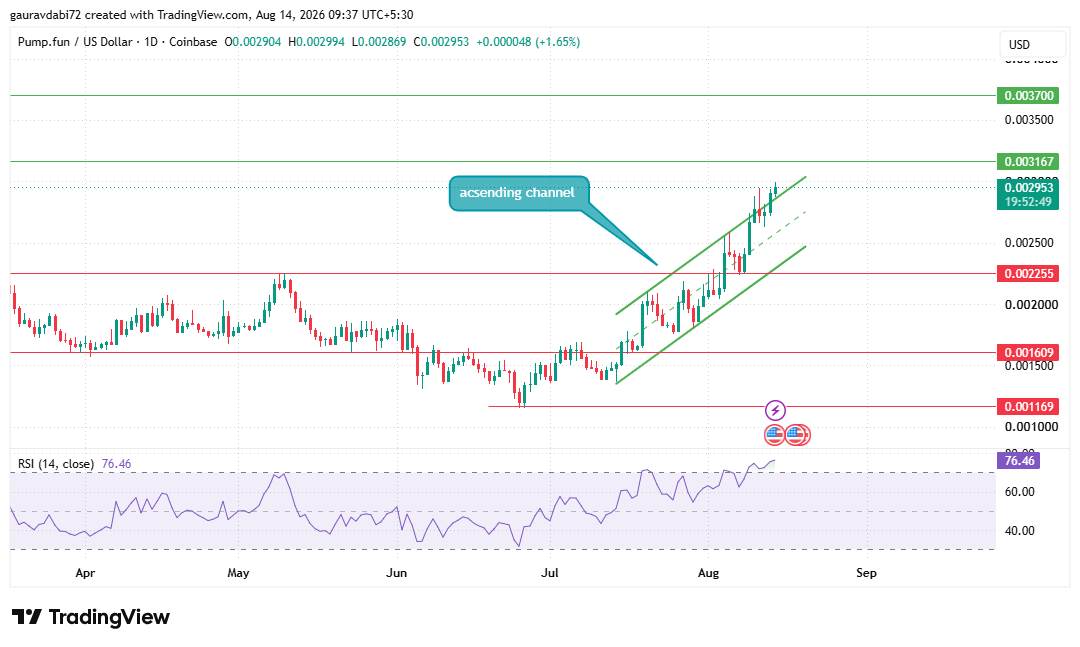 This can only be regarded as an attempt at a breakthrough, not a confirmation of a breakthrough. It would be almost meaningless for prices to break through resistance in a single period without a daily close that lasted for several days and firmly above the channel. Momentum indicators support gains, but also carry warning signs. The daily RSI reading was 76.46, which was clearly overbought. This does not mean that prices must reverse here, but it increases the importance of watching the market perform at resistance rather than assuming that prices will rise in a straight line. If a breakthrough is confirmed, the first resistance to focus on is $0.003167. If buyers can still control the situation after that,$0.003700 will become the next target. If prices fall short of the channel they have just recovered and fall back internally, it will be the first warning signal of a failure to break through. US$0.002255 below is the first major horizontal support, and if selling pressure strengthens, deeper support is at US$0.001609. Only when there is greater structural damage will $0.001169 become a target to consider, rather than a direct downside risk in the current scenario.
Pump.fun Price Forecast: Two Scenarios Worth Watching
Scenarios| Specific performance
continues to rise| The daily line continues to close firmly above the channel, first opening the path to the resistance zone of US$0.003167. If buyers continue to control, they will look further towards US$0.003700.
Breakthrough Failure/Callback| Prices slipped back into the rising channel, with the first support level of US$0.002255 and deeper support of US$0.001609. US$0.001169 only makes sense after further significant deterioration.
Can short squeeze evolve into a sustained breakthrough?
Although the outcome of the key contradiction here is uncertain, the context is clear: a breakthrough attempt, overbought daily RSI, clear short squeeze, and rising open interest contracts occurred at the same time, and not all of them pointed in the same direction. Squeeze and position data suggest momentum is real, but overbought readings and high leverage also mean the rally could quickly reverse if buyers hesitate. The daily line continues to close firmly above the channel, which will significantly enhance the bullish reasons. Until then, this was just an attempt, not a result.
What are we focusing on next
If the daily line closes firmly above the channel and the RSI cools off from extreme levels, it will support the assumption of continued gains. If prices slide back into the channel, it weakens breakthrough attempts and shifts attention to pullback scenarios. At the same time, the speed of short liquidations is also worth tracking, as a slowdown in forced short liquidations will remove a driving factor behind the current rally.