Exchange Ranking
 Top Exchanges
 24h Volume Ranking
 Popularity Ranking
 Exchange BTC Balance
 Proof of Reserves
 Decentralized Exchanges
 Funding Rate
 Funding Heatmap
 Liquidation Data
 Max Pain
 Long/Short Ratio
 Whale L/S Ratio
 Binance/Okex/Huobi L/S
 Bitfinex Margin L/S
 ETF Tracker
 Solana ETF
 XRP ETF
 Hong Kong ETF
 Bitcoin Treasuries
 Crypto Reversal
 Ethereum Reserves
 HyperLiquid Wallet Analysis
 Hyperliquid Whale Watch
 Large Transactions
 On-chain Movement
 Bitcoin ROI
 Stablecoin Market Cap
 Options Analysis
 News
News Articles
 Economic Calendar
 Features
 Wallet
 Contract Calculator


 Security
 Collections
 Watchlist
 Following
 SHIB
SHIB SHIB gained support near annual lows, declining resistance compressed prices, and traders paid close attention to liquidity and momentum.
Large positions and market values provide a solid foundation, but greater liquidity remains critical to sustained recovery.
New meme liquidity may boost demand, but the chart still needs to break through downward resistance to confirm momentum.
SHIB remains near key support areas, with declining resistance compressing prices, leaving traders focused on volume and momentum to find the next directional change after months of weakness.
Support maintained after prolonged sell-off
A post from SHIBMoral described the token as likely to wake up near its low. The post mentioned 3.07 million holders and a market value of US$2.66 billion. It also links new meme liquidity to the need for established meme assets to be able to return.
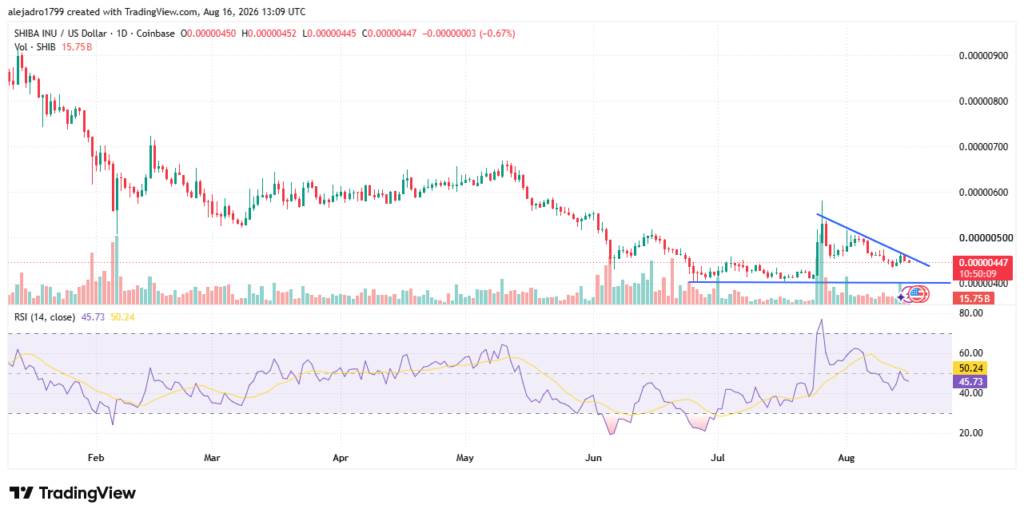
The daily chart shows that prices have experienced a long-term decline from levels above $0.0000900. Sellers maintain control through consecutive lower highs and lower lows. However, prices did start to stabilize in the $0.0000400 region.
The chart shows that the token price is close to US$0.0000447. The latest trading day opened close to US$0.0000450 and then fell slightly. Prices remain close to the established US$0.0000430 - 0.0000440 support area.
 Source:Tradingview
This support area became very important after multiple failed rebound attempts. Recent candle lines have repeatedly returned to the same lower boundary. As a result, despite limited upward momentum, buyers remain defensive.
Downtrend line limits rebound attempts
A blue downtrend line now connects several recent highs. This structure was formed after a rebound in late July exceeded $0.0000500. That breakthrough attempt attracted higher volume, but failed to produce sustained follow-up.
Afterwas rejected, the price fell back into the lower trading range. Since then, the rebound has been below the downward resistance line. This model tends to continue consolidating in the short-term structure.
Decisively breaking through this trend line may change the current technology landscape. Stronger volume will make this trend more credible than a surge in low volume. The next area of resistance will form around $0.0000500-$0.0000530.
Conversely, continued rejection could put new pressure on support levels. A clear break below $0.0000430 would weaken the current base. Sellers may then try to extend the broader decline to lower levels.
RSI shows cautious market momentum
According to the chart displayed, the 14th RSI is currently around 45.73. Its moving average remains close to 50.24, putting momentum below the stronger bullish threshold. However, this indicator has not yet entered the oversold area.
The RSI structure shows that neither buyer nor seller has gained decisive control. Early weakness repeatedly pushed the indicator into oversold status. Recent stabilization produced more balanced momentum readings.
Trading volumes also support a cautious interpretation of current price movements. Activity increased sharply during attempts to rebound in late July. However, as prices moved sideways below downward resistance, volume fell.
The broader market outlook also depends on new speculative liquidity. SHIBMoral points to the large holder base as the source of existing market participation. However, the number of holders alone cannot confirm the recruitment of funds or ensure stronger demand in the future.
As a result, as of this writing, the market landscape remains technically compressed rather than clearly bullish. Buyers need to continue to break through downward resistance with greater participation. At the same time, sellers need to clearly lose support before they can regain directional control.
Before these two events, the market was still caught between downward resistance and established support. The next high-volume move should provide clearer evidence of the trend. Currently, the chart shows stabilization after weakness, but no reversal has been confirmed.