Exchange Ranking
 Top Exchanges
 24h Volume Ranking
 Popularity Ranking
 Exchange BTC Balance
 Proof of Reserves
 Decentralized Exchanges
 Funding Rate
 Funding Heatmap
 Liquidation Data
 Max Pain
 Long/Short Ratio
 Whale L/S Ratio
 Binance/Okex/Huobi L/S
 Bitfinex Margin L/S
 ETF Tracker
 Solana ETF
 XRP ETF
 Hong Kong ETF
 Bitcoin Treasuries
 Crypto Reversal
 Ethereum Reserves
 HyperLiquid Wallet Analysis
 Hyperliquid Whale Watch
 Large Transactions
 On-chain Movement
 Bitcoin ROI
 Stablecoin Market Cap
 Options Analysis
 News
News Articles
 Economic Calendar
 Features
 Wallet
 Contract Calculator


 Security
 Collections
 Watchlist
 Following
 DOGE
DOGE DOGE has been declining for several consecutive weeks, but trading volumes have taken on a different picture.
Dogecoin is the first memein. It started as a joke but has developed into one of the most valuable cryptocurrencies. This article's dogcoin price forecast will analyze DOGE's current position and the next trend predicted by the EMA cluster, key support and resistance levels. Market data was collected on August 18, 2026 at 14:46 (IST time).
Today's Dogecoin Price Forecast: Market Overview
Price: $0.06992;24-hour Change: -0.50%; Market Value: $10.85B; Fully Diluted Valuation: $11.95B;24-hour Volume: $287.96M; Volume/Market Value Ratio (24-hour): 2.45%; Total supply: 171.25B $DOGE; Maximum supply: No upper limit; Circulation supply: 155.54B $DOGE。Data is as of August 18, 2026 at 14:46 (IST time).
DOGE News: Falling but Resilient
A report from the BSCN noted that DOGE has fallen about 3.2% in the past 30 days and 32.9% in the past 90 days, but despite this, the asset is still described as resilient. 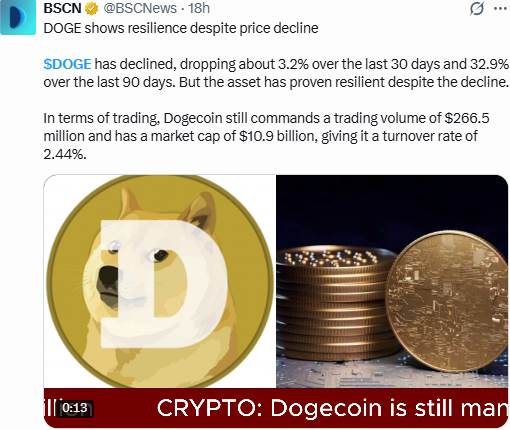 The report stated that trading volume was US$266.5 million and the market value was US$10.9 billion, which calculated a turnover rate of 2.44%. Combined with the 90-day decline, the conclusion is that DOGE's trading activity did not collapse like prices did, which is generally healthier than a decline in prices accompanied by a contraction in trading volume.
DOGE Coin Encryption News: The Most Critical Level in Three Years
An analyst account posted that DOGE is about to hit the most critical level in Three Years. 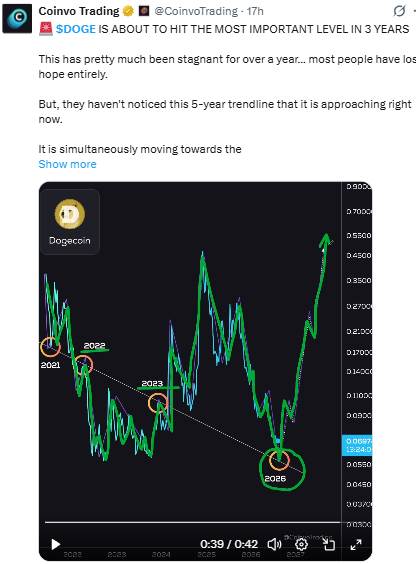 The view is that DOGE has been stagnant for more than a year and most traders have given up on it, but few have noticed that prices are simultaneously approaching a five-year downtrend line (which runs through band highs in 2021, 2022 and 2023) and approaching its historical bottom. The post also argued that most memecoins have actually died out, and only a few, including DOGE, are still alive. Note: This is only the analyst's interpretation of the chart, not confirmed data. It should be regarded as an opinion on the current trend rather than an inevitable result.
Today's DOGE Price Forecast: Technical Analysis
Trading Pair: DOGE/USDT ·Markets: Spot·Exchange: KuCoin ·Timeframe: 4 hours·Timestamp: August 18, 2026 14:46 UTC+5:30
DOGE is currently trading at $0.06992, and is consolidating in the shaded area between the first confirmed support level and the latest resistance level after falling back from the peak above $0.0720 on August 12. The RSI (Relative Strength Index) read at 47.31, close to the neutral 50 mark, indicating that the market is currently fairly balanced with no strong directional push. The EMA (exponential moving average) cluster is located just above the current price and is extremely tight: the EMA 20 is $0.07007 and the EMA 50 is $0.07012, both of which constitute direct resistance, and prices need to break through them before testing the upper boundary of the range. 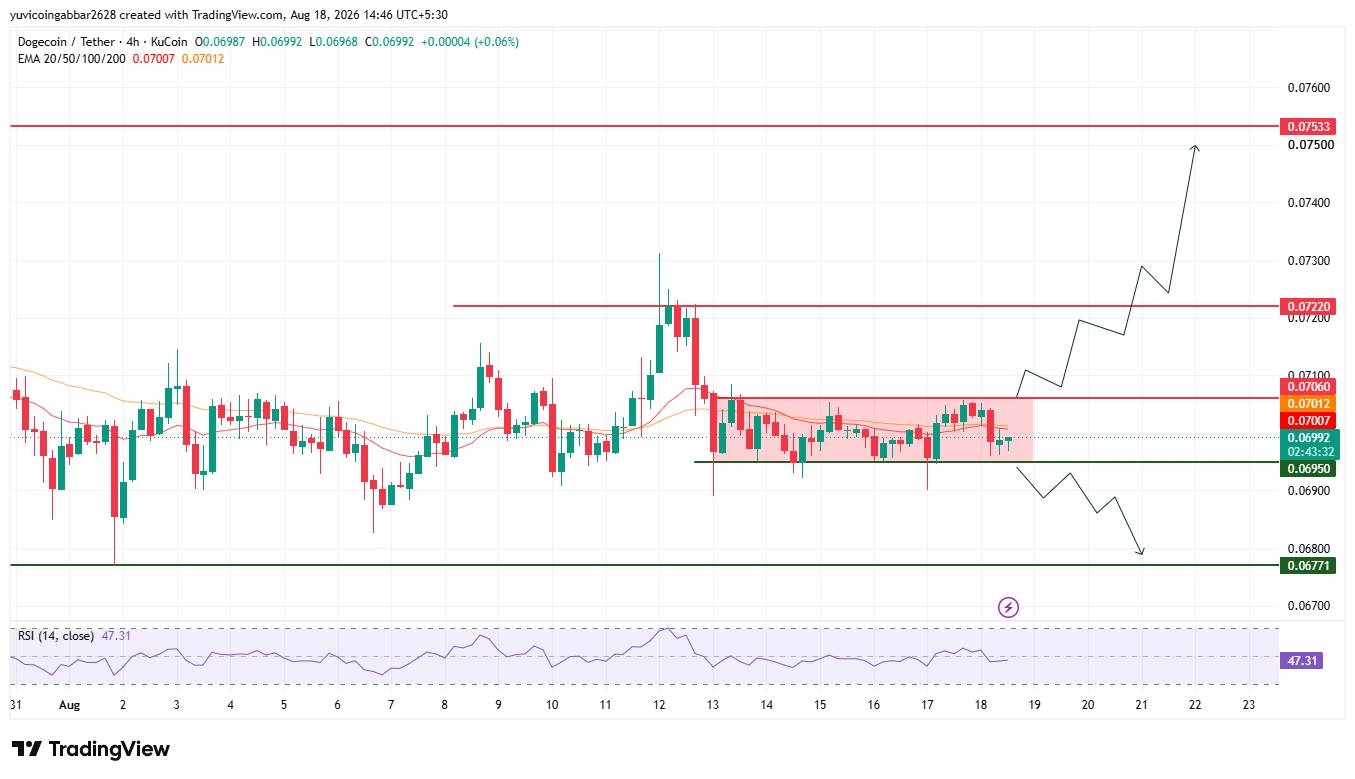
$DOGE Future Prices: Key Levels to Focus on
Resistance 3:$0.07533; Resistance 2:$0.07220; Resistance 1 (Recent):$0.07060; Immediate Price Reference: $0.06992; First Support: $0.06950; Deeper Support: $0.06771。
$DOGE EMA Level
EMA 20:$0.07007;EMA 50:$0.07012.
Dogecoin forecast: bullish vs bearish scenario
$DOGE 2026 price target: The bullish scenario
breaks through the tight EMA cluster around $0.07007 to $0.07012 and stabilizes above the first confirmed support level of $0.06950, which will open the way to the nearest resistance level of $0.07060, and then $0.07220 and $0.07533.
$DOGE 2026 price target: A bearish scenario
A break below $0.06950 will put the current range at risk and bring deeper support level of $0.06771 into view. If DOGE fails to hold here while testing the multi-year trend line from below, it will technically reinforce the view that the "most critical level of three years" is being broken rather than held.
Price Scenario: Trigger Conditions and Expiration Conditions
Scenario 1: EMA Recovery. Trigger condition: Closing price is above $0.07012. Possible results: Prices open paths to $0.07060,$0.07220, and $0.07533. Failure condition: Fall back below $0.07007.
Scenario 2: Range is stable. Trigger conditions: Price remains between $0.06950 and $0.07060. Possible outcome: Consolidation continues near current levels. Expiration condition: Closing price is less than $0.06950.
Scenario 3: The range breaks below. Trigger condition: Closing price is below $0.06950. Possible outcome: Falling towards $0.06771. Failure condition: Recovering $0.06950.
$DOGE Price Target: Can $DOGE Reach $0.07533?
$0.07533 is the highest resistance level marked on the chart. To reach this position,$DOGE needs to first break through the tight EMA cluster around $0.07007 to $0.07012, firm above the first confirmed support level of $0.06950, and then break through and firm the nearest resistance levels of $0.07060 and $0.07220. This is a multi-stage progression rather than a one-leg trend, especially if the broader trendline test on the higher time frame has not yet yielded results.
What might invalidate the bullish pattern?
was rejected at the EMA cluster near $0.07007 to $0.07012, and then closed back below the first confirmed support level of $0.06950, which would put the current range in doubt. A further break below $0.06771 would completely disrupt the pattern and, combined with the failure to hold the long-term trend line, would support a more bearish interpretation of the current position of $DOGE.
2026 Dogecoin Price Forecast: Expert Analysis
According to CoinGabbar analysts, the short-term chart for $DOGE is very compact and fairly balanced: the RSI is 47.31 and the EMA cluster is only a few points wide, indicating that the market is waiting for a trigger rather than a definite direction. The analyst post raises a bigger question: $DOGE tests both a five-year trend line and its historical bottom area-a combination that, if accurate, will make the next move in a higher time frame more decisive than usual range trading. The BSCN data brings some comfort: Although prices have slipped over the past 90 days, trading volumes have remained stable, which is usually a sign that participants are still participating rather than giving up.$ The 0.06950 to $0.07060 area is the first range to pay attention to, and the larger trend line story unfolds above and below it.
Disclaimer : This article is for reference only and does not constitute financial advice. The above levels and scenarios are based on technical chart analysis and public data at the time of writing. The cryptocurrency market may fluctuate violently within hours, so past patterns cannot guarantee future results. Before taking action at any level discussed here, be sure to research and consider your own risk tolerance.