Exchange Ranking
 Top Exchanges
 24h Volume Ranking
 Popularity Ranking
 Exchange BTC Balance
 Proof of Reserves
 Decentralized Exchanges
 Funding Rate
 Funding Heatmap
 Liquidation Data
 Max Pain
 Long/Short Ratio
 Whale L/S Ratio
 Binance/Okex/Huobi L/S
 Bitfinex Margin L/S
 ETF Tracker
 Solana ETF
 XRP ETF
 Hong Kong ETF
 Bitcoin Treasuries
 Crypto Reversal
 Ethereum Reserves
 HyperLiquid Wallet Analysis
 Hyperliquid Whale Watch
 Large Transactions
 On-chain Movement
 Bitcoin ROI
 Stablecoin Market Cap
 Options Analysis
 News
News Articles
 Economic Calendar
 Features
 Wallet
 Contract Calculator


 Security
 Collections
 Watchlist
 Following
 BTC
BTC  SHIB
SHIB Shiba Inu Coin (SHIB) has once again sparked heated discussions. A wildly circulated post said that the shantcoin season is about to break out, and specifically pointed out that SHIB will usher in an "awakening." The chart itself also reveals that prices have recently broken through a long-term decline channel and quickly retreated, and are currently at a key support level that may determine the next big move. This Shiba Inu Price Forecast will analyze whether this support level can be held, whether there is technical support for the altcoin craze, and how key price levels may evolve by 2030.
Market data check time: August 19, 2026, 11:55 Indian Standard Time.
What is the price of SHIB today?
Indicators| Value
Price| $0.000004470
24-hour change| +1.86%
Market Value| $2.62B
Fully outstanding market value| $2.62B
24-hour trading volume| $48.01M
Volume/Market Value (24 hours)| 1.83%
Liquidity/Market Value| 0.15%
Total Supply| 589.49T SHIB
Maximum supply| 589.55T SHIB
Circulation Supply| Number of 589.23T SHIB
Holders| 3.07M
Is SHIB about to start the altcoin season? What does the tweet claim
A Whale News Daily post on X claimed that Shiba Inu is about to trigger the altcoin season, calling it an "awakening" and pointing to a monthly OTHERS/BTC chart showing an expected breakthrough of more than 300% from a multi-year decline pattern.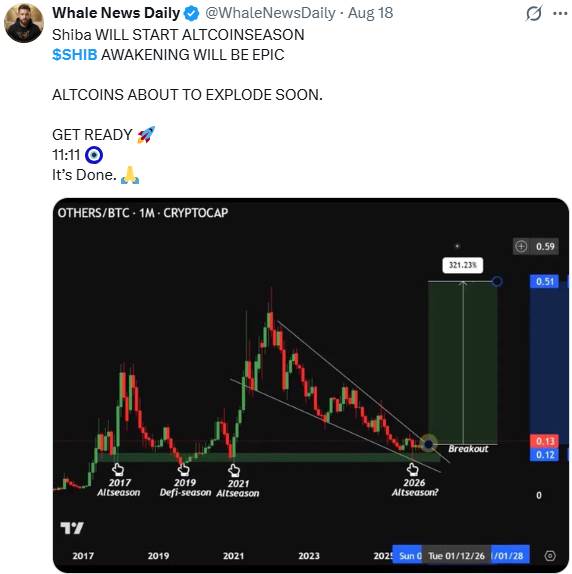
Note: Analysts cannot independently verify this statement and it lacks support from SHIB-related on-chain data. This is a broad view of the overall altcoin market cycle and is not a specific signal for SHIB, so it should be seen as speculation rather than confirmation of a trend.
Shiba Inu Price Forecast Chart: Technical Analysis
Trading Pair: SHIB/USDT ·Market: Spot (Cryptocurrency)·Exchange: KuCoin ·Timeframe: 1st·Source: TradingView ·Timestamp: August 19, 2026, UTC+5:30 11:55
Since mid-2024, SHIB has been trading in a long-term downtrend channel, forming lower highs and lower lows within the structure. In May 2026, prices were pushed up to the $0.00006604 area, which looked like a channel breakthrough, but the trend failed and fell back, marking on the chart as a false breakthrough or buyer's trap. Prices fell back to the bottom of the channel in June and early July, and then broke through the upper trend line of the channel in late July and rose sharply to the $0.000005313 area. The breakthrough has not yet been confirmed as prices have since adjusted back and are currently consolidating around $0.00004470, slightly above the old channel boundary. The EMA cluster is nearby, with the 20-cycle EMA around $0.00004545 and the 50-cycle EMA around $0.00004800, both posing resistance before recovering. The daily RSI of SHIB is 46.44, which is near the neutral zone.$ 0.000004363 and $0.00004072 levels are currently a test of breaking the trend line. Holding these levels maintains the effectiveness of the breakthrough in late July, and failure to comply with the rules will pull prices back into the old downward channel. 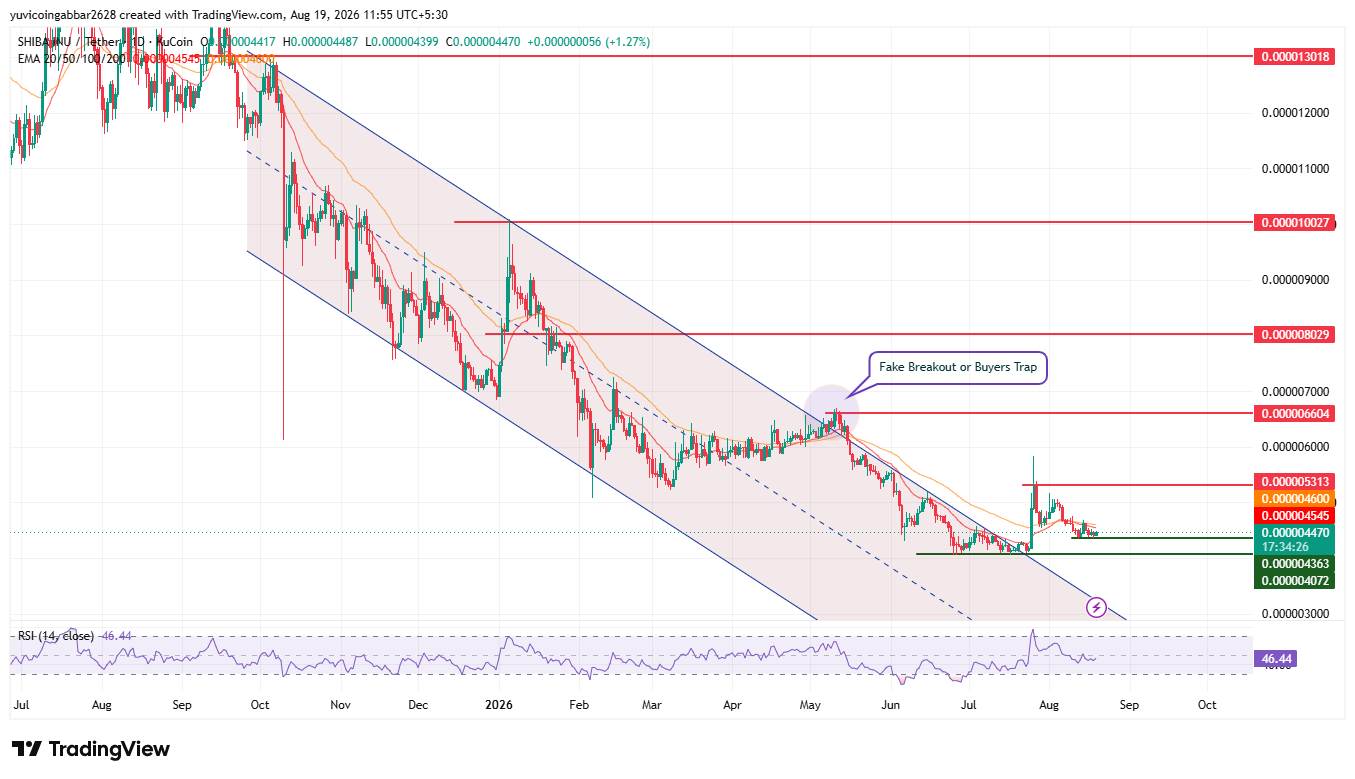
Key price levels for Shiba Inu coins before the next big move
Level types| Price
Resistance 4| $0.000013018
Resistance 3| $0.00010027
Resistance 2| $0.000008029
Resistance 1 (false breakthrough area)|$0.000006604
Recent resistance| $0.000005313
Instant price reference| $0.000004470
First support| $0.000004363
Deeper support| $0.00004072
EMA level| Price
EMA 20| $0.000004545
EMA 50 |$0.000004800
Shiba Inu 2026 forecast: bullish scenario vs bearish scenario
SHIB 2026 price target
bullish scenario: Holding $0.00004363 and recovering the EMA cluster around $0.00004545 to $0.00004800 will confirm that the late July breakthrough is being maintained rather than fading. A closing above $0.000005313 will open the way to the $0.00006604 area for the May rejection price, and it will be significant to truly break through that area this time.
Bear scenario: A break below $0.00004363 would put a breakthrough in doubt and risk falling back to $0.00004072, effectively pulling prices back into the old channel. Falling to that level would repeat May's rejection, just from the other side of the structure.
2026 SHIB Price Scenario: Triggers and Expiration Points
Scenario| triggers| possible outcomes| Failure point
Breakout maintenance/bullish| Recovering EMA clusters near $0.00004545-$0.00004800| Move towards $0.00005313 and retest $0.00006604| Falling below $0.00004363
range consolidation| Prices remain between $0.000004363 and $0.00005313| Horizontal shock, waiting for the next move| Break through either boundary
Channel reentry/bearish| Close below $0.00004363| Fall back into the channel and move towards $0.00004072| Recovering $0.000004363
Shiba Inu Price Forecast 2026
The path of the SHIB now depends on whether the channel breakthrough in late July can be maintained. If $0.00004363 is held as a support level, then the move to the EMA cluster and the $0.00005313 to $0.00006604 area is realistic, this time from outside the old channel structure. A break below brings the focus back to $0.00004072 and returns to the channel.
Scenario| 2026 target range
bearish (breakthrough failed)|$0.000030 to $0.000044
Basic scenario (range oscillation)|$0.000044 to $0.000053
Bullish (Breakout Hold)|$0.000053 to $0.000066
Shiba Inu Price Forecast 2027
The key level remains $0.000006604, which is the area where SHIB was rejected in May. Confirming a close above that level would mark a real structural shift.
Scenario| 2027 target range
bearish| $0.000035 to $0.000066
Bully| $0.000066 to $0.0000100
Shiba Inu Price Forecast 2028
Scenario| 2028 Target Range (Speculative)
Bear| $0.000040 to $0.000070
Bully| $0.000070 to $0.0000130
Shiba Inu Price Forecast 2029
Scenario| 2029 Target Range (Speculative)
Bear| $0.000035 to $0.000090
Bully| $0.000090 and above
Shiba Inu Price Forecast 2030
Scenario| 2030 target range (speculative)
Bear| $0.000025 to $0.000045
Bully| $0.000090 to $0.0000200
Shiba Inu Price Forecast: Expert Opinion
According to analysts, the false breakthrough in May is a key data point: SHIB's attempt to break away from its years of channel was strongly rejected, which is exactly the form that requires respect rather than neglect. The RSI is 46.44 and currently has no significant bias, with prices at support and the EMA still overhead, indicating that this is a wait-and-see area. Tweets about the altcoin season added noise, but did not provide confirmation for SHIB.$ 0.000004363 Level is the key to pay attention to-if you hold on to it, recovery attempts will remain viable, and if you fail to comply, you will return directly to the bearish channel structure.
Disclaimer : This article is for information reference only and does not constitute financial advice. The above levels and scenarios are based on technical chart analysis and public data at the time of writing. The cryptocurrency market may fluctuate violently within hours, so past patterns cannot guarantee future results. Long-term scenarios (especially from 2028 to 2030) are speculative and are not based on confirmed data. Before taking action at any level discussed here, it is recommended to conduct independent research and consider your own risk tolerance.