Exchange Ranking
 Top Exchanges
 24h Volume Ranking
 Popularity Ranking
 Exchange BTC Balance
 Proof of Reserves
 Decentralized Exchanges
 Funding Rate
 Funding Heatmap
 Liquidation Data
 Max Pain
 Long/Short Ratio
 Whale L/S Ratio
 Binance/Okex/Huobi L/S
 Bitfinex Margin L/S
 ETF Tracker
 Solana ETF
 XRP ETF
 Hong Kong ETF
 Bitcoin Treasuries
 Crypto Reversal
 Ethereum Reserves
 HyperLiquid Wallet Analysis
 Hyperliquid Whale Watch
 Large Transactions
 On-chain Movement
 Bitcoin ROI
 Stablecoin Market Cap
 Options Analysis
 News
News Articles
 Economic Calendar
 Features
 Wallet
 Contract Calculator


 Security
 Collections
 Watchlist
 Following
Cash Cat Current Price: A Glance of Key Data
CASHCAT has fallen sharply from its high in early August, but its market value is still close to US$94 million. Traders are watching whether the pullback finds a bottom or deepens further.
This article analyzes the data behind this round of decline through trading volume and liquidation trends, and sorts out key prices that may determine the direction of the market outlook. The market data review will be completed on August 19, 2026 at 15:50 (Indian Standard Time).
Cash Cat Current Price: List of key data
Indicators Values
Price $0.094462
24-hour ups and downs-8.94%
Market Value $94.46M
[_TAG 23] Fully diluted market value $94.46M24-hour volume $20.67M
Volume/market value (24h) 22%
Clearing volume/market value 7.12%
Total supply 1B CASHCAT
Maximum supply 1B $CASHCAT
Circulation supply 1B $CASHCAT
data as of August 19, 2026 at 15:50 (Indian Standard Time). Data from different tracking platforms may vary slightly.
CASHCAT Volume and Liquidation Data: Highlights from the Chart
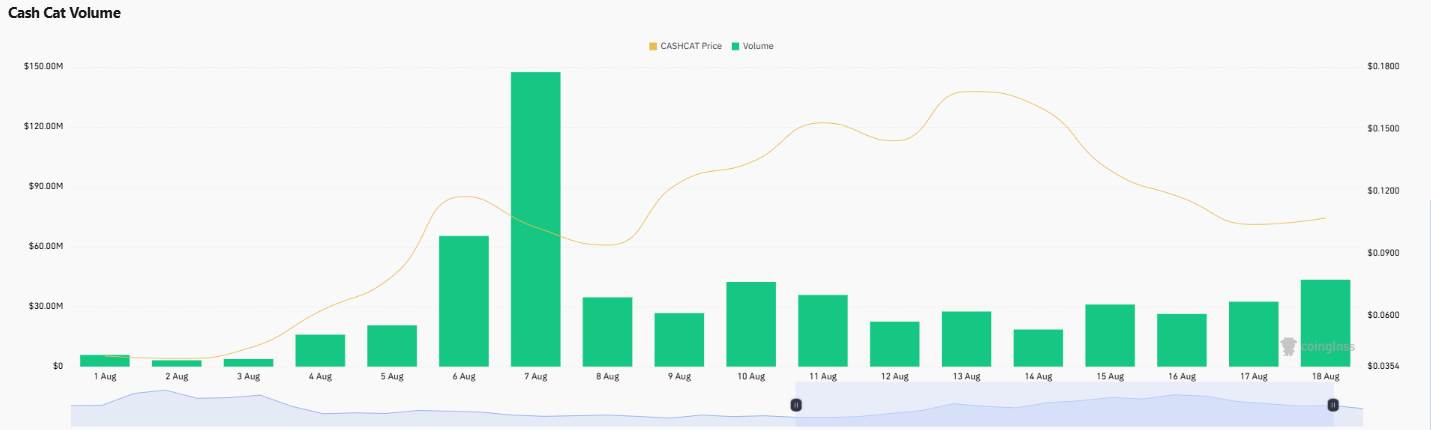 Daily trading volume soared to nearly $150 million on August 7, as prices were accelerating towards a peak; then fell back to a stable range of $25 million to $45 million in mid-August. Volume has rebounded in the last two trading days (August 17-18), suggesting that market interest has regained momentum despite the price correction.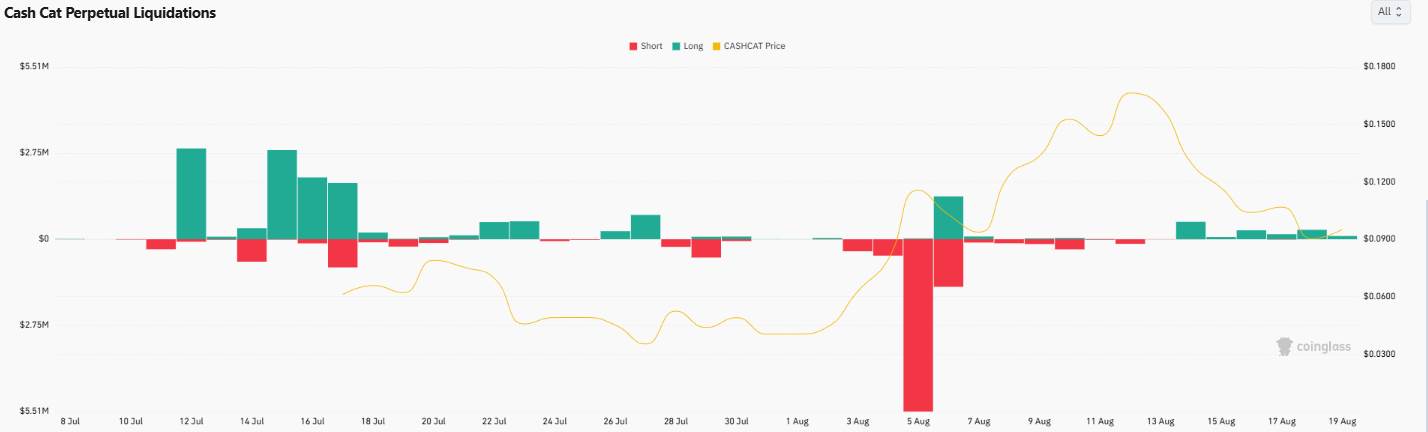
The history of liquidation reveals a more acute picture. On August 5, short positions were hit hard and more than US$2.5 million were liquidated in a single day. CASHCAT prices then rushed into the rise in early August-a typical short squeeze pattern. Since its mid-August peak, liquidations have become smaller and more balanced, with small long liquidations dominating as prices have fallen, indicating that this correction has not yet triggered a leverage scare like in July.
How traders view CASHCAT
Trader Drallio posted on the X platform that CASHCAT is the target pursued by most memes on the "Robinhood chain", and even if the trading volume cools, it can maintain a market value of nearly US$100 million, it is worth paying attention to. 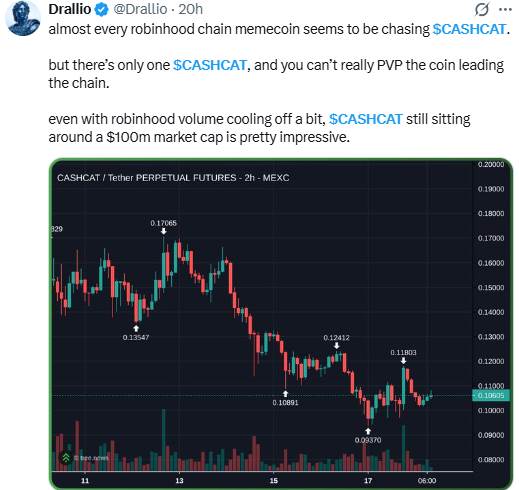 Note: This is the personal opinion of the account. It is not verified data, but it reflects the current mainstream narrative surrounding CASHCAT.
Cash Cat Price Forecast Chart: Technical Analysis
Trading Pair: CASHCAT/USDT ·Market: Spot (Cryptocurrency)·Timeframe: Daily Line·Timestamp: August 19, 2026 15:50 UTC+5:30
CASHCAT pulled strongly from approximately $0.034702 to a peak near $0.166134 in early to mid-August, and then entered the downward channel. Prices have fallen below that channel and are currently consolidating around $0.094658, just above key support. CASHCAT's daily RSI is 47.68, which is near neutral.
If prices hold on to support, they are expected to move upwards; if they fall below support, selling pressure may emerge. 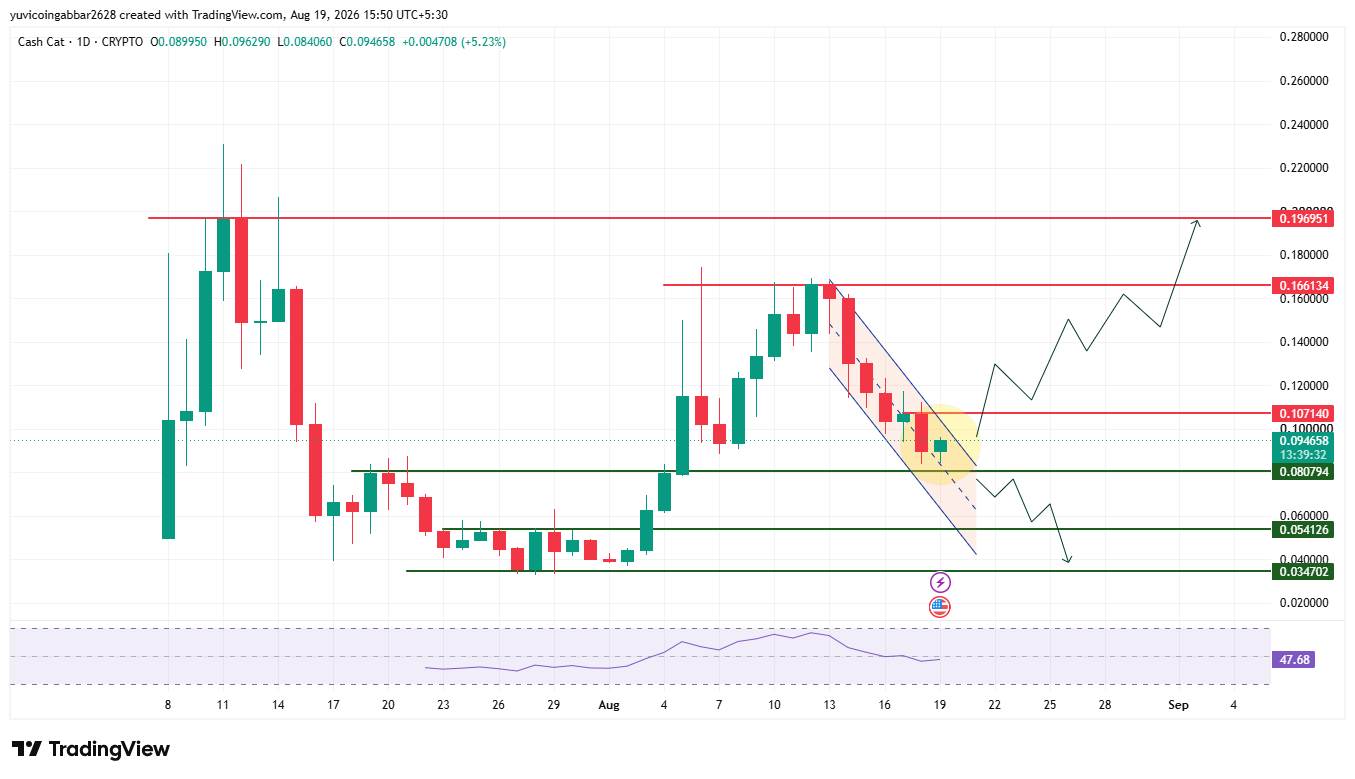
Support and Resistance
Type Price
Resistance 3 $0.196951
Resistance 2 $0.166134
Recent Resistance 1 $0.107140
Current Reference Price $0.094658
First support $0.080794
Deeper support $0.054126
Structure bottom $0.034702
Cash Cat forecast: Bullish scenario vs bearish scenario
CASHCAT 2026 price target
Bullish scenario: Standing above $0.080794 and recovering $0.107140 will indicate that the correction is stabilizing. Upon confirmation of a breakthrough in this level, the path will be opened to return to $0.166134.
CASHCAT 2026 price target
Beary scenario: closes below $0.080794 and may fall towards $0.054126; if selling accelerates, the next target will be the structural bottom of $0.034702.
CASHCAT Price Scenario: Trigger Conditions and Failure Conditions
Scenario Trigger Conditions Large probability result Failure Conditions
Support stabilization/bullish recovery of $0.107140 moved towards $0.166134 and $0.196951 fell below $0.107140 rejected
Range consolidation price fluctuated horizontally between $0.080794 and $0.107140 broke through either boundary
Broken position/bearish close below $0.080794 falls towards $0.054126 and $0.034702 recovers $0.080794
Can CASHCAT reach $0.196951?
$0.196951 is the highest resistance level noted on the chart, above CASHCAT's August high. To reach that position, you need to recover $0.107140 and then break through $0.166134-a multi-stage recovery rather than a rapid rise.
What could disrupt the bullish pattern?
Close below $0.080794, followed by continued selling to $0.054126, which will confirm that the August rally has completely reversed.
Cash Cat Price Forecast: Professional Analysis
Analysts point out that CASHCAT's trend so far has been a rapid pull-up driven by short squeeze, followed by an orderly correction rather than a panic sell-off. Liquidation data also confirms this: Since the high point, liquidations have become smaller and more balanced. The rebound in trading volume in the past two trading days is worthy of attention, because heavy volume near the support level often indicates the next directional trend. The most critical price currently is $0.080794.
Disclaimer : This article is for information reference only and does not constitute financial advice. The above prices and scenarios are based on technical chart analysis and public data at the time of writing. The cryptocurrency market may fluctuate violently within hours, and past performance cannot guarantee future results. Before taking action based on any of the price points discussed here, please independently research and consider your own risk tolerance.