Exchange Ranking
 Top Exchanges
 24h Volume Ranking
 Popularity Ranking
 Exchange BTC Balance
 Proof of Reserves
 Decentralized Exchanges
 Funding Rate
 Funding Heatmap
 Liquidation Data
 Max Pain
 Long/Short Ratio
 Whale L/S Ratio
 Binance/Okex/Huobi L/S
 Bitfinex Margin L/S
 ETF Tracker
 Solana ETF
 XRP ETF
 Hong Kong ETF
 Bitcoin Treasuries
 Crypto Reversal
 Ethereum Reserves
 HyperLiquid Wallet Analysis
 Hyperliquid Whale Watch
 Large Transactions
 On-chain Movement
 Bitcoin ROI
 Stablecoin Market Cap
 Options Analysis
 News
News Articles
 Economic Calendar
 Features
 Wallet
 Contract Calculator


 Security
 Collections
 Watchlist
 Following
 BTC
BTC  ETH
ETH  ONDO
ONDO  PEPE
PEPE  SOL
SOL  SUI
SUI  ZEC
ZEC Pepe, launched in 2023, is a meme coin built around the well-known Internet frog image and quickly became one of the most traded meme tokens on the market. Its current trading price is approximately US$0.0000314, an intraday increase of more than 21%, and its market value reaches US$1.321 billion, ranking around 57th in the cryptocurrency market value ranking. This Pepe price forecast is based on the judgment of this retest result.
Real-time Market Data
Indicator: Price; Value: US$0.0000314
Indicator: 24-hour change; Value: +21.5%
Indicator: 24-hour price range; Value: US$0.0000025740-US$0.000032050
Indicator: Market Value; Value: US$1.321 billion
Indicator: Fully diluted valuation; Value: US$1.321 billion
Indicator: 24-hour trading volume; Value: US$416.965 million
Indicator: Circulation supply; Value: 420.69 trillion
Indicator: Total supply; Value: 420.69 trillion
Indicator: Maximum supply; Value: 420.69 trillion
Liquidation Snapshot
The trend of PEPE has triggered a total of US$1.58 million in liquidations in the past 24 hours. Among them, short positions have been hit much more than long positions, with losses reaching US$1.2 million, while long liquidation was only US$380,950, indicating that short positions were caught off guard by the rebound. 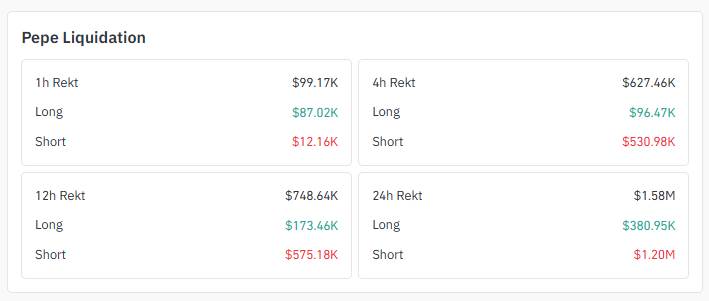
The 12-hour window showed a similar pattern, with short liquidation of US$575.18 million and long liquidation of US$173.46 million. The 4-hour window also showed the same trend, with short liquidation reaching US$530,980, far exceeding the long position of US$96,470. Only the one-hour window reversed, with long losses even greater, with a liquidation amount of US$87.02 million and short losses of only US$12.16 million, implying that some short-term funds chasing the rally were quickly stopped and eliminated.
Trading volume distribution
In PEPE futures trading, OKX led with trading volume of US$258.66 million, far exceeding MEXC's US$178.73 million and LBank's US$111.22 million. 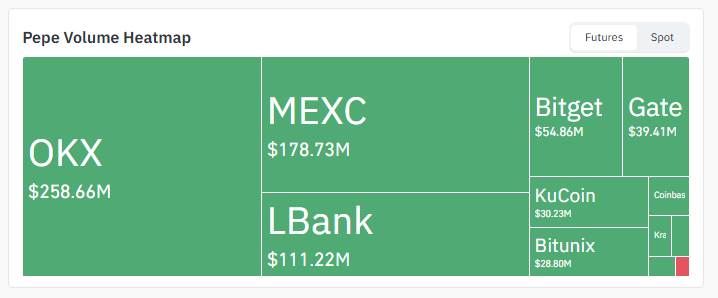
Bitget and Gate constitute the second echelon, while KuCoin and Bitunix, although contributing less, also account for a certain share of the total.
Today's PEPE News
As the cryptocurrency market overall rises, social media sentiment around PEPE has turned bullish. The report pointed out that after Bitcoin recently exceeded the US$68,000 mark, PEPE also rose. 
The same comment also mentioned that Solana and Zcash also rose simultaneously, while the broader altcoin market, including Sui, Ondo and Ethereum, was in bullish mode. This general trend across assets generally supports a continuation of the trend rather than an isolated surge, which is consistent with the bullish trend shown in the liquidation data in this Pepe price forecast.
Key Points
PEPE has broken through the decline channel of previous transactions, and prices are currently retesting the breakthrough zone near US$0.000031.
The current price is at US$0.0000314 and has risen 21.5% in the past 24 hours, with a 24-hour price range of US$0.000025740 to US$0.0000032050.
Direct resistance is at US$0.0000329. If this level is clearly exceeded, it may open up upside space to US$0.0000346 or even US$0.0000383.
Support below the current region is US$0.0000296, and if the retest fails, deeper support is US$0.0000277 and US$0.00000263.
Liquidation data showed that short positions suffered major losses in the past 24 hours, suggesting that the rally caught bearish positions off guard.
Technical Analysis
4-hour chart analysis
On the short-term chart, PEPE has been oscillating downward in the downtrend channel before, with the upper part being suppressed by the downtrend line and the lower part also supported by the corresponding trend line.
This channel has now been broken. Prices have significantly crossed the channel and are currently in the retest area near $0.000031. 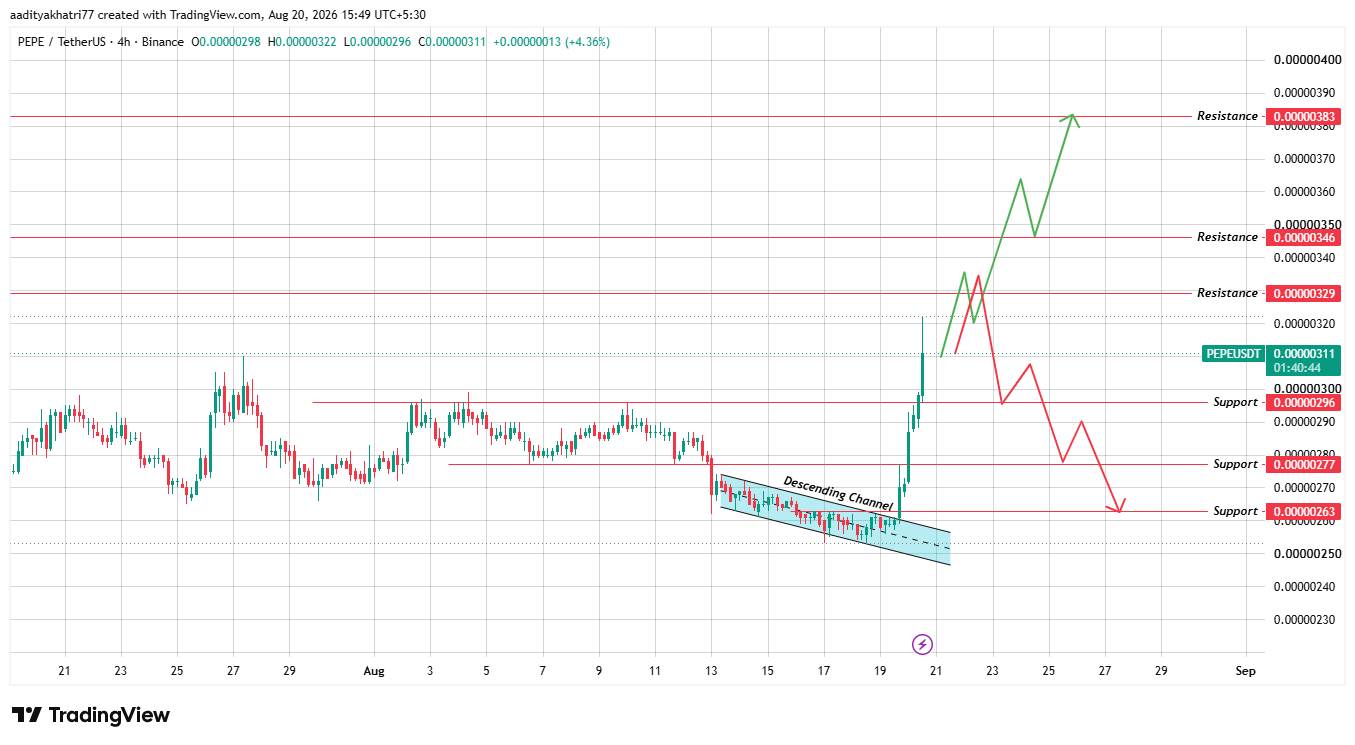
After that, the key is whether the breakout area can stand as a new support. If the buyer puts a lot of volume here, the price should first move toward $0.0000329, then $0.0000346 and $0.0000383. If resistance is blocked and the breakout area is not held, a reversal is possible and the price will fall back to $0.0000296. If the selling pressure continues, the next support levels are $0.0000277 and $0.0000263. For this Pepe price forecast, the focus for the next few trading sessions is on this.
Support and Resistance Levels
Resistance level 3: US$0.0000383
Resistance 2: US$0.0000346
Resistance 1: US$0.0000329
Current reference price: US$0.00000311
First support level: US$0.00000296
Deeper support level: US$0.00000277
Structural Support: US$0.0000263
These key levels in this Pepe price forecast come directly from the chart, from top resistance to structural support.
Analysis of three scenarios
Bullish scenario: The price touches the range of US$0.0000329-US$0.0000383; Failure condition: Failure to close above US$0.0000329 under high volume.
Neutral scenario: The price fluctuated within the range of US$0.0000296-US$0.0000329, and there was no clear directional breakthrough.
Bear scenario: the price falls to US$0.0000277 or lower; trigger condition: the breakthrough area near US$0.0000296 falls and the old downtrend channel resumes.
The above three scenarios form the basis of this Pepe price forecast, and their weights depend on the results of retesting of breakthrough areas in the next few trading sessions.
Glossary
Falling channel: A chart pattern consisting of two parallel and downwardly sloping trend lines connecting a series of lower highs and lower lows.
Breakthroughs: Prices clearly cross (or cross) a given chart boundary, often indicating a potential trend shift.
Retest: Prices return to the support or resistance level where they were breached after a breakthrough to see if the level has shifted to the opposite effect (support becomes resistance, or resistance becomes support).
Liquidation: Forced liquidation of a leveraged trading position when the loss exceeds the trader's margin.
Resistance level: Historically, the price level at which seller pressure is strong enough to prevent further price increases.
Support: Historically, a price level at which buyer pressure is strong enough to prevent further price declines.
Market value: The total value of all tokens in circulation, calculated by multiplying the price by the supply in circulation.
Methodology
All price levels, supporting resistance areas, and channel structures cited in this PEPE price forecast are directly derived from the PEPE/USDT charts on TradingView, and cross-referenced real-time market data and Coinglass clearing data at the time of writing. All price levels fell within the range supported by the chart structure itself.