Exchange Ranking
 Top Exchanges
 24h Volume Ranking
 Popularity Ranking
 Exchange BTC Balance
 Proof of Reserves
 Decentralized Exchanges
 Funding Rate
 Funding Heatmap
 Liquidation Data
 Max Pain
 Long/Short Ratio
 Whale L/S Ratio
 Binance/Okex/Huobi L/S
 Bitfinex Margin L/S
 ETF Tracker
 Solana ETF
 XRP ETF
 Hong Kong ETF
 Bitcoin Treasuries
 Crypto Reversal
 Ethereum Reserves
 HyperLiquid Wallet Analysis
 Hyperliquid Whale Watch
 Large Transactions
 On-chain Movement
 Bitcoin ROI
 Stablecoin Market Cap
 Options Analysis
 News
News Articles
 Economic Calendar
 Features
 Wallet
 Contract Calculator


 Security
 Collections
 Watchlist
 Following
 SHIB
SHIB  BONE
BONE SHIB is still compressed within a triangle, with buyers resisting selling pressure near the rising support level, while selling pressure continues near the resistance level.
Shibarium continues to support SHIB destruction through BONE transaction fees, adding a supply-reducing factor to the ecosystem.
A break in support could reopen July lows, while a break in resistance would enhance recovery prospects.
The SHIB market outlook remains cautious, with prices consolidating within a tightening triangle, and continued destruction provides another factor for long-term market observers.
The daily structure is still trapped within the triangle
The daily chart shows that the SHIB price is US$0.0000442, and the price is approaching the lower boundary of the triangle. Recently, the K-line shows that directional confidence is limited, and the long and short sides are evenly matched. The overall structure still reflects a long-term decline since highs earlier this year. 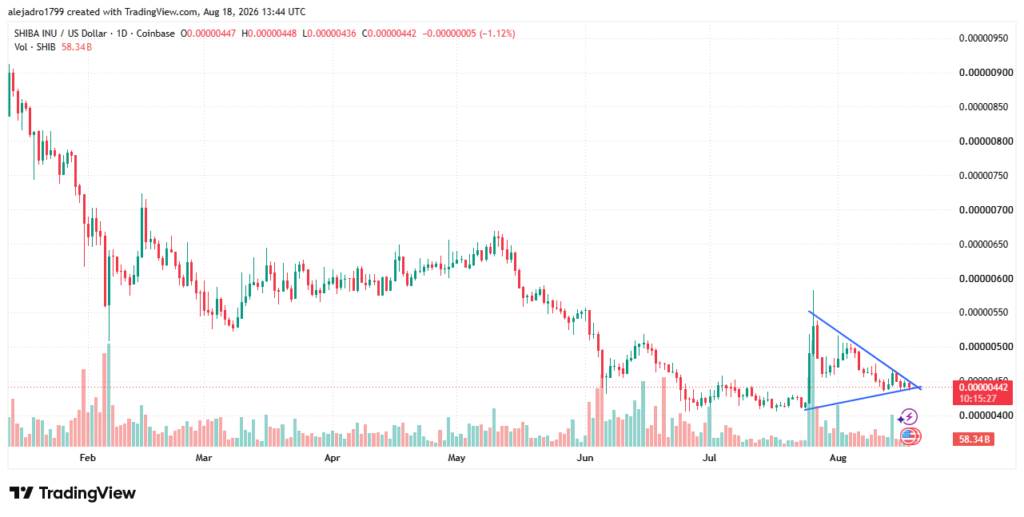
After the market failed to rebound at the end of July, it reached consecutive falling highs. At the same time, a rising support line has been formed below the recent consolidation range. These opposing boundaries form a narrowed structure that requires directional confirmation.
The downtrend line continues to limit the rebound to the upper edge of the pattern. At the same time, the uptrend line has provided support many times in recent trading sessions. This compression suggests that traders are waiting for a clearer signal of participation before deciding on direction.
Trading volumes also weakened after a surge accompanied by a rise in late July. Trading volume was lower during the consolidation period, indicating a decrease in participation compared to the previous expansion period. Therefore, when any triangle breaks out, an increase in volume will provide useful confirmation.
Support and resistance define the current pattern
As of writing, support on the daily chart is in the US$0.000043 - 0.000044 range. Decisively closing below the area will weaken the emerging bottom. Such a trend could redirect attention towards the $0.000041 near the July low.
The next downside reference point is still the psychological level of US$0.000040. This level is below the recent consolidation range and may attract new buying interest. However, losing this position will expose the market to further technical weakness.
On the positive side, there is a resistance cluster in the US$0.000049 - 0.000050 region. Continued breakthroughs in this region will break the series of continuously declining highs. The surge towards US$0.000055 - 0.000058 at the end of July remains the next major supply area.
Thus, the triangle provides a clearly defined level for both market directions. Buyers need to break through the resistance, while sellers need to confirm that the support has broken. Until either event occurs, the chart remains in a consolidating structure rather than a confirmed trend reversal.
Shibarium Destruction Supports Supply Narratives
In a recent X post, SHIBMoral discussed comments from longtime supporter Mazrael. The discussion stems from a question about the continued relevance of BONE in the Shiba Inu ecosystem. Mazrael explained that BONE maintains contact with destruction through Shibarium's fee mechanism.
BONE is used for trading as a Gas token for the Shibarium network. According to Mazrael, part of the fees charged supported SHIB destruction through ShibTorch. He also said hundreds of millions of tokens had been destroyed in recent weeks.
Therefore, this mechanism links online transactions with the continued decline in circulation supply. Mazrael noted that the process continues despite relatively limited community attention. He described the event as being low-key and without continued public discussion.
This supply-reduction activity is separate from the immediate technical structure of the chart. Destruction can reduce circulation supply, but market supply and demand still determine the price direction. At present, technical confirmation still depends on the final breakthrough or break of the triangle.