Exchange Ranking
 Top Exchanges
 24h Volume Ranking
 Popularity Ranking
 Exchange BTC Balance
 Proof of Reserves
 Decentralized Exchanges
 Funding Rate
 Funding Heatmap
 Liquidation Data
 Max Pain
 Long/Short Ratio
 Whale L/S Ratio
 Binance/Okex/Huobi L/S
 Bitfinex Margin L/S
 ETF Tracker
 Solana ETF
 XRP ETF
 Hong Kong ETF
 Bitcoin Treasuries
 Crypto Reversal
 Ethereum Reserves
 HyperLiquid Wallet Analysis
 Hyperliquid Whale Watch
 Large Transactions
 On-chain Movement
 Bitcoin ROI
 Stablecoin Market Cap
 Options Analysis
 News
News Articles
 Economic Calendar
 Features
 Wallet
 Contract Calculator


 Security
 Collections
 Watchlist
 Following
 SPX
SPX SPX6900 ($SPX) Price Forecast
SPX6900 ($SPX) is a satirical memecoin built around market commentary of "numbers rising", positioning itself as a playful alternative to the S & P 500. The price is currently trading at around $0.4332 and has fallen slightly in the past 24 hours after a week of sharp correction. This SPX6900 price forecast is based on its daily chart structure, EMA positioning and derivatives data to explore the possible next direction for SPX.
Real-time market data
Current market data: The price is US$0.4332, the 24-hour change is-1.6%, the 24-hour interval is US$0.4306-US$0.4938, the market value is US$403.26 million, the fully diluted valuation is US$403.26 million, the 24-hour transaction volume is US$22.076 million, the circulation supply is 930.987 million, the total supply is 930987 million, and the maximum supply is 1 billion.
Liquidation snapshot
Liquidation data for each time period: Total clearing in one hour is US$1,940 (Long is US$1930, short is US$7.5);4-hour total liquidation is US$9820 (long is US$9820, short is US$7.5);12-hour total liquidation is US$222,84 million (long is US$157.65 million, short is US$65.19 million);24-hour total liquidation is US$250,57 million (long is US$160.11 million, short is US$90.46 million). Bulls suffered more severe liquidations during all tracking periods, which is consistent with prices retreating into the FVG area after the initial breakout surge. This suggests that some leveraged buyers entered early during the retest without waiting for a confirmation signal.
Exchange trading volume
SPX6900 futures trading volume was led by Binance, with a 24-hour trading volume of US$16.2 million, followed by Bybit's US$10.97 million and BingX's US$7.1 million. MEXC, Hyperliquid, KuCoin, OKX and Bitget accounted for the remaining smaller shares. 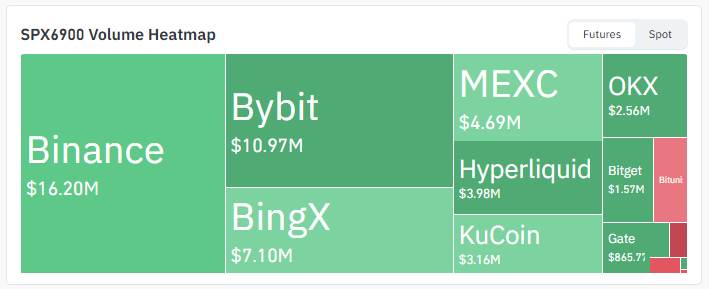 Trading volume here is significantly lower than that of large-cap tokens, so price fluctuations in this SPX6900 price forecast may move faster in either direction with relatively small order flows.
Core Points
SPX6900 trading price was approximately US$0.4332, down 1.6% in 24 hours, following a heavy volume breakthrough in the downward wedge on the daily chart. The breakthrough left a fair value gap that prices are currently retesting and this SPX6900 price forecast identifies it as a key decision-making area. If it rebounds successfully from FVG, it is expected to rise to $0.4974, followed by $0.5591 and $0.6553. If you fail to hold the area, there is a risk of falling back to US$0.3598 or even US$0.3091. Long positions have suffered a greater proportion of liquidations in all time frames, including the largest impact in the past 24 hours.
Technical Analysis
Daily Chart: Wedge Breakout ushered in the first backtest
SPX had been consolidating within the declining wedge for several weeks before finally breaking with a real volume surge instead of a quiet slow upward movement. This volatility left a fair value gap on the chart, which has now been retested directly by the price pullback. 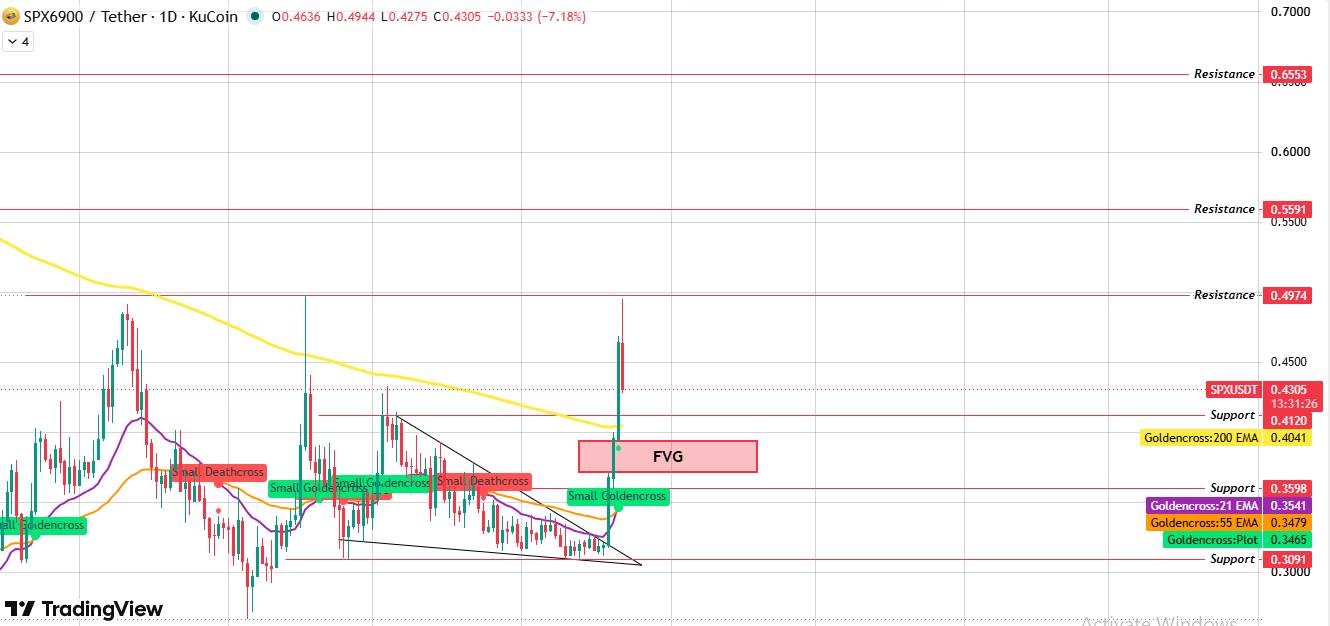 The key to this SPX6900 price forecast lies in the results of this backtest. If it rebounds from FVG, it will be confirmed that the breakthrough is effective and the path to US$0.4974 will be reopened. If momentum accumulates further, the target levels will be extended to US$0.5591 and US$0.6553. However, if prices cannot hold on to the region and break downward, the bullish structure will weaken quickly, with the downside focusing on US$0.3598 and US$0.3091.
EMA level
EMA values: 200 EMA is US$0.4041, 21 EMA is US$0.3541, 55 EMA is US$0.3479. The current price is above all three major EMAs, and the 200 EMA, which is directly below the FVG support area, adds an additional convergence of support to this level. The short-term EMA has formed a small golden fork, which echoes the wedge breakthrough. As long as the FVG backtest is established, it will add technical weight to the bullish direction of this SPX6900 price forecast.
Support and Resistance
Resistance 3: US$0.6553; Resistance 2: US$0.5591; Resistance 1: US$0.4974; Current price: US$0.4332;FVG/Support area: US$0.4120; Support 1: US$0.3598; Support 2:$0.3091.
Call, benchmark and bear scenarios
Bullish scenario: FVG is established as a support level and buyers re-enter. The target level is $0.4974-$0.6553, and the failure level is below $0.4120. Benchmark scenario: Prices fluctuate within the FVG region, waiting for direction choice. The range of US$0.4120-US$0.4974 will expire if it breaks below US$0.3598. Bear scenario: FVG failed to hold and support fell below. The target level is $0.3598-$0.3091, and the failure level is below $0.3091.
Glossary
Declining wedge: A chart shape in which prices compress between two downwardly sloping convergence lines. Upward breakthroughs (especially those accompanied by increased volume) are often seen as bullish reversal signals. Fair value gap (FVG): The price range left by sharp price fluctuations that bypass normal trading activity. Prices tend to retreat into these areas later, either rebound or break through directly. Golden Cross: The bullish signal that appears when the short-term moving average crosses the long-term moving average is often seen as an early sign of the strength of the trend. EMA (Exponential Moving Average): A moving average that gives higher weight to recent price data and is more sensitive to short-term price changes than a simple moving average. Liquidation: When the loss on a leveraged futures position exceeds the margin available to a trader, it is forced to close the position. Concentration of long liquidations during pullbacks often indicates buyers entering too early. Backtest: Prices return to the level where they previously breached (such as wedge boundary or FVG) to confirm whether the level is now serving as support or resistance.
Methodology
This SPX6900 price forecast is based on daily chart technical analysis, EMA positioning, real-time clearing and futures trading volume data from Coinglass, and current market data. All quoted price levels are derived directly from the charts provided and do not include any extrapolations or speculative levels.
Disclaimer : This article is for information purposes only and does not constitute financial, investment or trading advice. Cryptocurrency markets (including SPX6900) are highly volatile and speculative. Any price level, goal or scenario discussed is a probabilistic observation based on technical data rather than a guarantee. Please research and consult a qualified financial adviser before making an investment decision.