Exchange Ranking
 Top Exchanges
 24h Volume Ranking
 Popularity Ranking
 Exchange BTC Balance
 Proof of Reserves
 Decentralized Exchanges
 Funding Rate
 Funding Heatmap
 Liquidation Data
 Max Pain
 Long/Short Ratio
 Whale L/S Ratio
 Binance/Okex/Huobi L/S
 Bitfinex Margin L/S
 ETF Tracker
 Solana ETF
 XRP ETF
 Hong Kong ETF
 Bitcoin Treasuries
 Crypto Reversal
 Ethereum Reserves
 HyperLiquid Wallet Analysis
 Hyperliquid Whale Watch
 Large Transactions
 On-chain Movement
 Bitcoin ROI
 Stablecoin Market Cap
 Options Analysis
 News
News Articles
 Economic Calendar
 Features
 Wallet
 Contract Calculator


 Security
 Collections
 Watchlist
 Following
 DOGE
DOGE  SHIB
SHIB Dogecoin and Shiba Inu: Why traders put them together to observe
Meme tokens rarely occur in isolation, as the current market pattern of Dogecoin and Shiba Inu clearly demonstrates this. The discussion about "Dog Coin vs. Shiba Inu Coin" is heating up again. Dog Coin was launched in 2013 as a joke based on the Shiba Inu Internet meme, while Shiba Inu Coin debuted in 2020, positioning itself as a competitor in the same category in the Ethereum ecosystem. Since then, both have established a large retail user base and have always become one of the most traded Meme tokens.
As of the latest data, the trading price of dogcoin is $0.08442, up 0.7% in the past 24 hours; the price of Shiba Inu is $0.0000520, up 2.6% over the same period. Both prices are within their respective 24-hour trading ranges and have not yet exceeded their immediate trend-line structure.
Market Indicators DOGE Shiba Price $0.08442 $0.000052024 Hour Change +0.7%+2.6%24-Hour Trading Range $0.08289-$0.0879 $0.00005004-$0.00005391 Market Value $13.159B $3.068B Fully Diluted Valuation $13.159B$3.069B24-hour trading volume $760.554M $83.221M circulating supply 155.88B589.239T Total supply 155.88B589.496T Maximum supply unlimited-Data source: CoinGecko Market Data, as of September 12, 2026. Data from other tracking sites may differ slightly.
Exchange Trading Volume Analysis
Dogecoin Trading Volume Data
Trading activity in Dogecoin is mainly concentrated in Binance, with a 24-hour trading volume of $541.50M, followed by OKX ($367.07M) and Bybit ($133.87M).
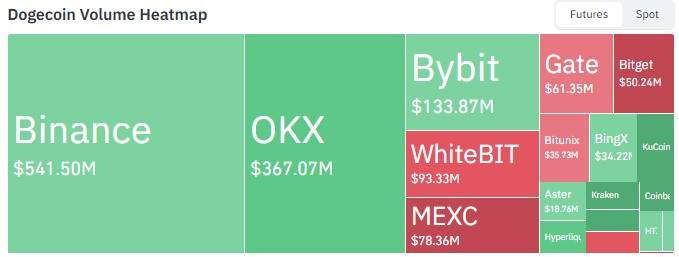 Source: CoinGlass trading volume heat map data, as of September 12, 2026.
Platforms such as WhiteBIT, MEXC, Gate, Bitget and Bitunix contribute between approximately $35M and $93M in transaction volume, indicating that liquidity is widely distributed among major exchanges rather than relying on a single platform.
Shiba Inu Trading Volume Data
Shiba Inu Trading Volume and Price are small in absolute terms, but the distribution is equally scattered.
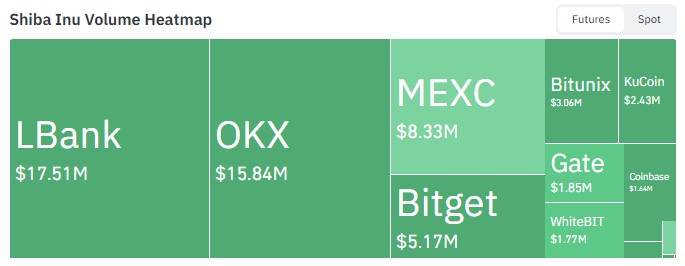 Source: CoinGlass trading volume heat map data, as of September 12, 2026.
LBank led with $17.51M, OKX followed closely with $15.84M, and MEXC contributed $8.33M. Trading volumes on platforms such as Bitget, WhiteBIT, Bitunix, KuCoin, Gate and Coinbase are all in the singular range of millions of dollars.
Market sentiment
Latest developments in Dogecoin
In addition to its native chain performance, recent Dogecoin news also involves significant cross-chain adoption cases. According to BSCN,$DOGE on the Solana chain has maintained a stable momentum after its launch, with records for three consecutive days showing that the 24-hour transaction volume reached $8.83M among 143,779 independent transactions.
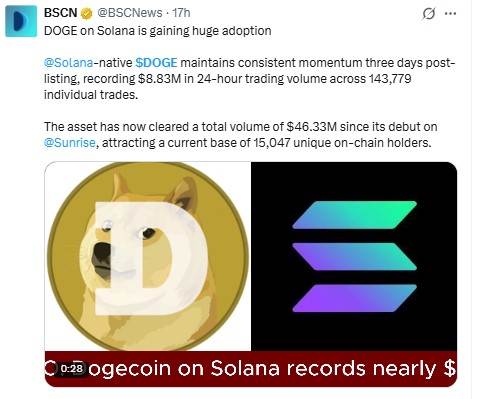 Data source: @BSCNews X account, as of September 12, 2026.
The report added that since the token was launched on Sunrise, the total transaction volume has reached $46.33M, with 15,047 unique on-chain holders currently participating in the transaction.
Latest news on Shiba Inu
The latest Shiba Inu news focuses on the growth in the number of holders. BSCN reported that the number of Shiba Inu holders is approaching 1.7 million, and Etherscan data shows that the current number of SHIB holders is 1.689 million.
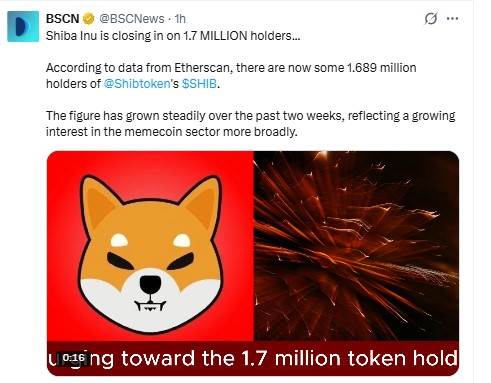 Data source: @BSCNews X account, as of September 12, 2026.
The media pointed out that this number has grown steadily over the past two weeks, reflecting expanding retail interest across the Meme token space rather than activity driven by a single event.
Technical Analysis: Dogecoin (4-hour chart)
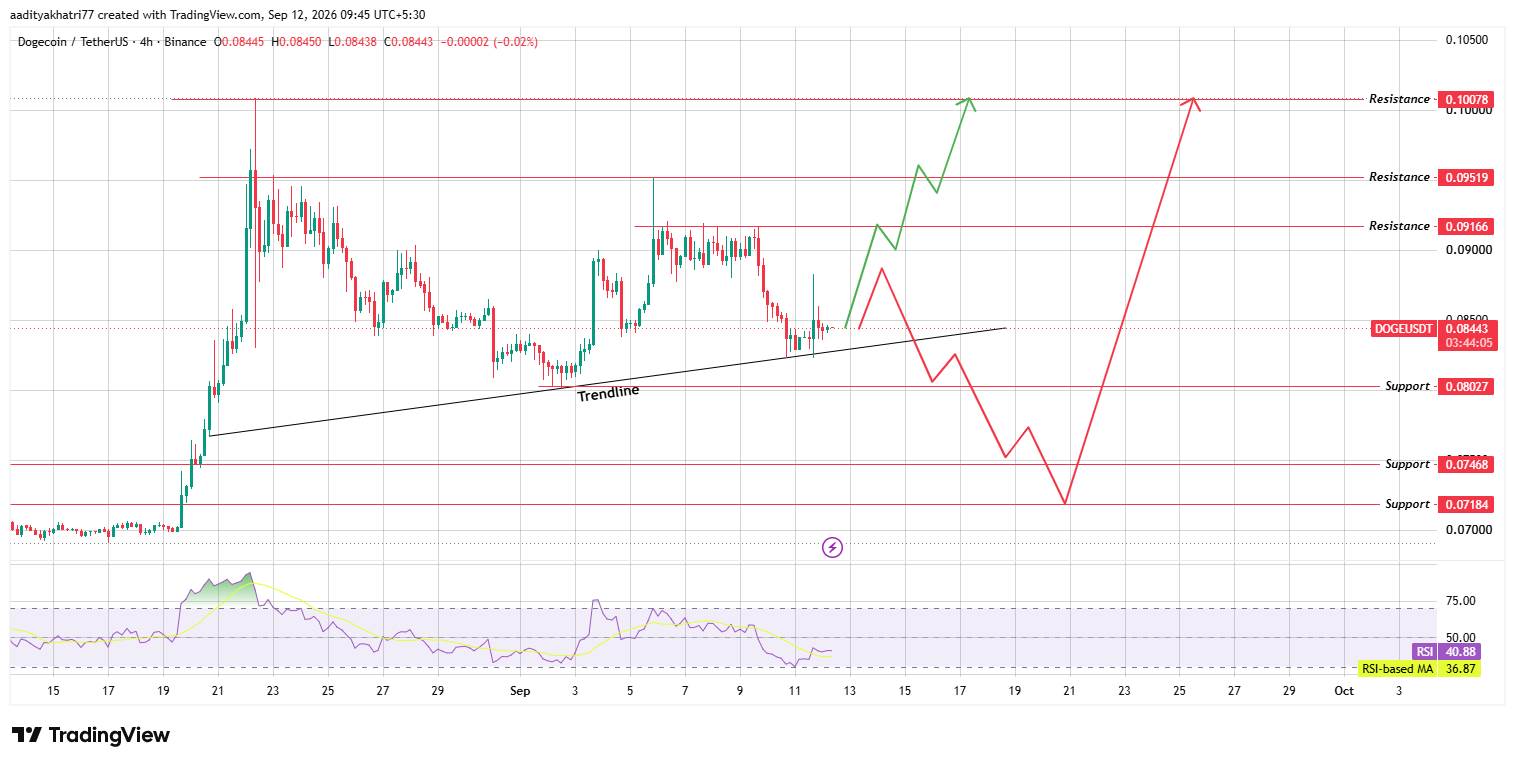
As of the close of the K-line on September 12, Dogecoin was trading above the uptrend line on the 4-hour chart, and the price consolidated around $0.08443 after recent fluctuations.
 Source: TradingView charts, as of September 12, 2026.
The Relative Strength Index (RSI) is at 40.88, below its moving average of 36.87, indicating that despite the higher overall structure, kinetic energy remains neutral or slightly weak.
Bullish scenario: Can DOGE push higher resistance?
If Dogecoin remains above the trend line and the 4-hour K-line closes above the first resistance level of $0.09166 as the volume increases, there is room for a path to $0.09519 and eventually $0.10078. Continued breakthroughs in these levels will confirm a continuation of the broader upward trend since late August.
Bear scenario: What would happen if DOGE fell below the trend line?
If the rebound fails to maintain and the price closes below the uptrend line, Dogecoin risks falling to the first support level of $0.08027. Further downside may test $0.07468 and $0.07184. While it is possible to recover from these lower support levels to resistance levels, this will take a long time and must occur after the correction is over.
Support Resistance $0.08027 $0.09166$0.07468$0.09519$0.07184$0.10078 Dogcoin bullish, benchmark and bearish scenarios
Scenario sets conditions Target/range bullish 4 hours to close above the resistance level, with volume confirmation $0.10078 Benchmark prices holding the trend line, Oscillating between key levels by $0.08027-$0.09166 The bearish trend line breaks, and then testing the support level by $0.07184 Technical analysis: Shiba Inu (daily chart)
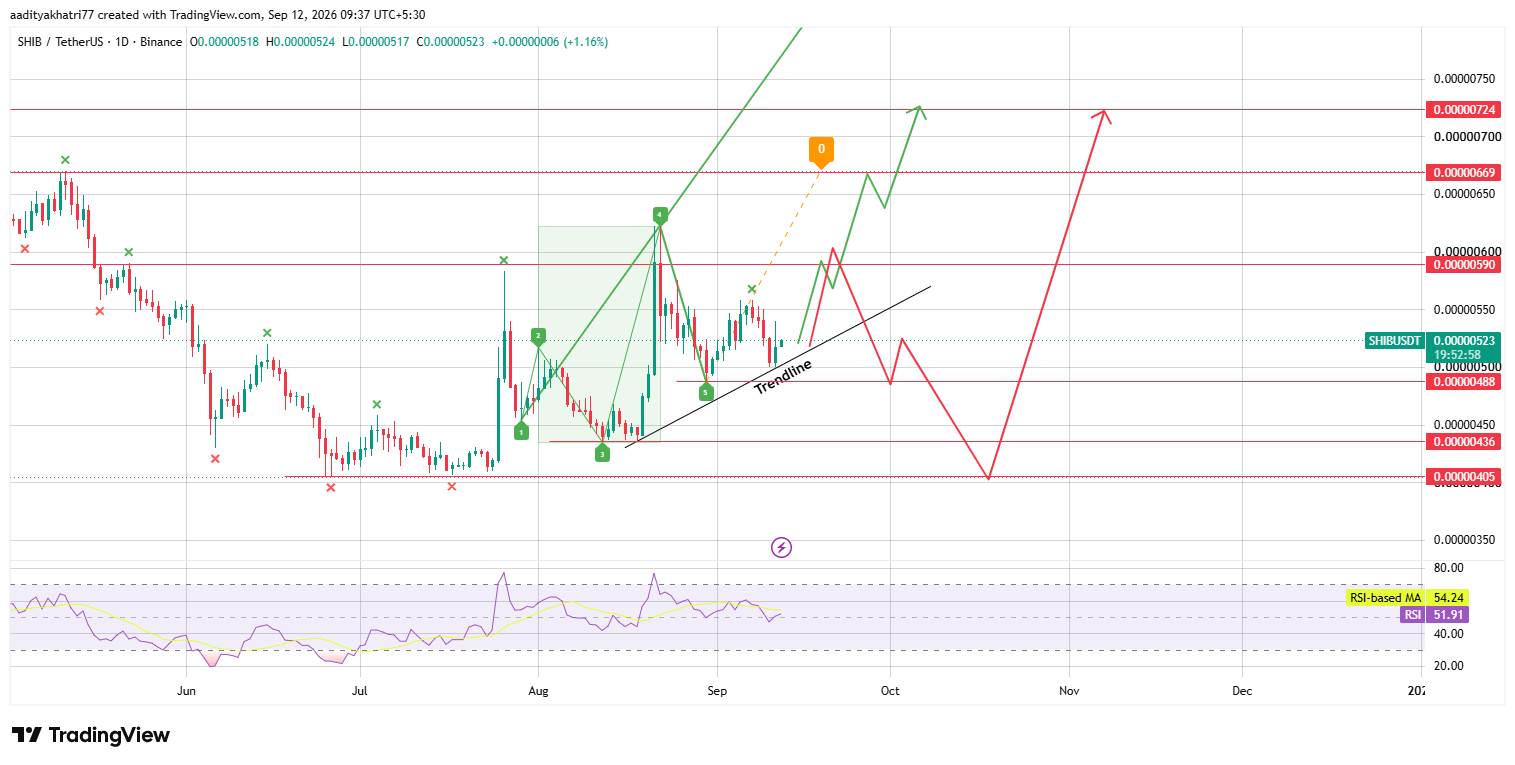
As of the close of September 12, the price of Shiba Inu is above its uptrend line on the daily chart, and the "Wolfe Wave" pattern can be seen structurally.
 Source: TradingView charts, as of September 12, 2026.
This pattern usually indicates that prices will return to the target line after completing the final swing, in this case pointing to the upper resistance zone.
Bullish scenario: Can SHIB break through resistance?
If the daily K-line closes above the first resistance level of $0.0000590 supported by increased volume, it will verify the setting of the Wolf Wave pattern and open up space for access to $0.0000669 and $0.00000724. This will mark a critical transition from the recent consolidation phase to a meaningful transition.
Bear scenario: What happens when encountering a rejection?
If the Shiba Inu price is rejected at its current position and falls below the trend line, there is a high chance of falling to the lower support band near $0.0000500. If selling pressure continues, downside risks will deepen further to $0.0000436 and $0.0000405.
Support Resistance $0.0000500 $0.000590$0.0000436$0.0000669$0.0000405$0.0000724 Shiba Inu bullish, benchmark and bearish scenarios
Scenario Set conditional target/range bullish daily line closes above resistance, Activate Wolf Wave Target $0.0000724 Benchmark trend line holds steady, prices consolidate below resistance $0.0000500-$0.0000590 The bearish trend line breaks down, test down support $0.00000405 Dog Coin vs Shiba Coin
The market values of Dog Coin and Shiba Inu Coin are similar, at $13.159B and $3.068B respectively, but their technical forms differ in terms of time frames and structure. Dog Coin's current signal comes from a 4-hour chart, implying a shorter term decision point; while Shiba Inu's Wolf Wave pattern is forming on the daily chart, pointing to a slower, larger trend. The trading volume also distinguishes the two: the 24-hour trading volume of Dogou Coin reaches $760.554M, far exceeding Shiba Inu Coin's $83.221M, reflecting Dogou Coin's deeper liquidity and wider exchange distribution.
Despite these differences, both tokens are still above their respective uptrend lines. Given that Meme token sentiment tends to move synchronously, a confirmed breakthrough on either chart may attract renewed attention to another token.
Expert Opinion
Analysts believe that the persistence of Dogecoin's 4-hour trend line is a more urgent signal, and a closing above $0.09166 is a key confirmation observation point. The daily Wolfwave pattern of Shiba Inu is considered to form slowly, but once confirmed, it may bring a larger increase. However, since its trading volume is lower than Dogecoin, any breakthrough may bring more violent fluctuations. Overall comments tend to be optimistic that Dogou coins provide faster signals, while Shiba Inu coins provide larger but slower gains.
Disclaimer
The price forecast for Bendogu Coin and Shiba Coin is based on technical chart analysis and publicly available data as of September 12, 2026. Cryptocurrency prices are highly volatile, and actual results may differ significantly from the scenarios described. There is a possible probability that both bullish and bearish targets will not be achieved, and readers should not regard any of the levels quoted here as a guaranteed result. This content is for information reference only and does not constitute financial advice.