
 Exchange Ranking
 Top Exchanges
 24h Volume Ranking
 Popularity Ranking
 Exchange BTC Balance
 Proof of Reserves
 Decentralized Exchanges
 Funding Rate
 Funding Heatmap
 Liquidation Data
 Max Pain
 Long/Short Ratio
 Whale L/S Ratio
 Binance/Okex/Huobi L/S
 Bitfinex Margin L/S
 ETF Tracker
 Solana ETF
 XRP ETF
 Hong Kong ETF
 Bitcoin Treasuries
 Crypto Reversal
 Ethereum Reserves
 HyperLiquid Wallet Analysis
 Hyperliquid Whale Watch
 Large Transactions
 On-chain Movement
 Bitcoin ROI
 Stablecoin Market Cap
 Options Analysis
 News
News Articles
 Economic Calendar
 Features
 Wallet
 Contract Calculator


 Security
 Collections
 Watchlist
 Following
 DOGE
DOGE Dogecoin 在过去几周内持续收窄,价格波动区间越来越小,而不同时间框架下的图表开始呈现出两种截然不同的走势。短期结构似乎在蓄势待发,长期结构仍在消化前期的大幅下跌,而清算数据显示,杠杆交易者中某一方的亏损程度远高于另一方。这份狗狗币价格预测将三者综合考量,而非仅依赖单一图表。
当前狗狗币价格预测的驱动因素是什么?
本周 DOGE 交易价格约为 0.0741 美元,处于 4 小时图上的收窄形态中,而日线图仍显示出多周大幅下跌后的余波。这份短期狗狗币价格预测基于三个输入:过去一天内多头清算占主导的清算概况、4 小时图压缩至可能突破的形态,以及尚未确认趋势反转的日线 RSI。这些因素单独来看都无法定论,但综合起来,市场正处于真正的转折点,而非单向的明确趋势。
清算趋势揭示了交易者的哪些情况?
根据 Coinglass 过去 24 小时的清算数据,呈现出一边倒的局面。在过去的 24 小时内,多头仓位在总计 159 万美元的清算中占了 119 万美元,而空头清算仅为 39.38 万美元。4 小时和 12 小时窗口也呈现相同模式,多头清算占比均超过 95%。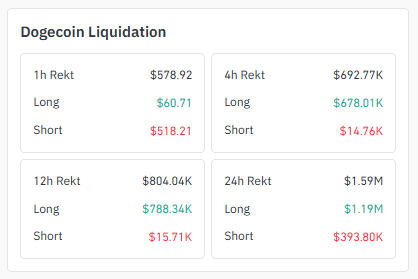
In the one-hour window, the reverse was, with short positions liquidating at $518.21, while long positions were only $60.71, indicating that although the broader daily chart still favors long losses, the very short-term rebound has caught late entry bears off guard.
How does exchange trading volume affect the outlook?
According to futures trading volume data compiled by CoinGlass, Binance is far ahead with trading volume of US$324.83 million, followed by OKX with US$233.18 million, and BingX with US$111.19 million. 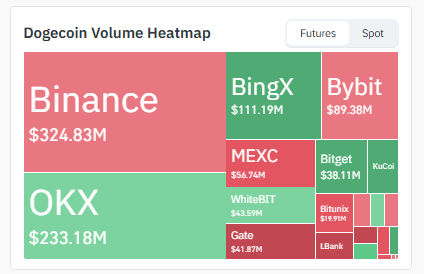 Bybit cleared US$89.38 million, while MEXC, WhiteBIT, Gate and Bitget each had transaction volumes ranging from US$38 million to US$57 million. This concentration means that sharp fluctuations on Binance or OKX often quickly set the tone for the entire market.
What is the indication of the 4-hour chart for dog coin price forecast?
The 4-hour chart presents a more balanced pattern. DOGE is compressing in a pattern similar to a symmetrical triangle, with upper resistance at $0.07576 and $0.07933 and lower support at $0.07185 and $0.0696. 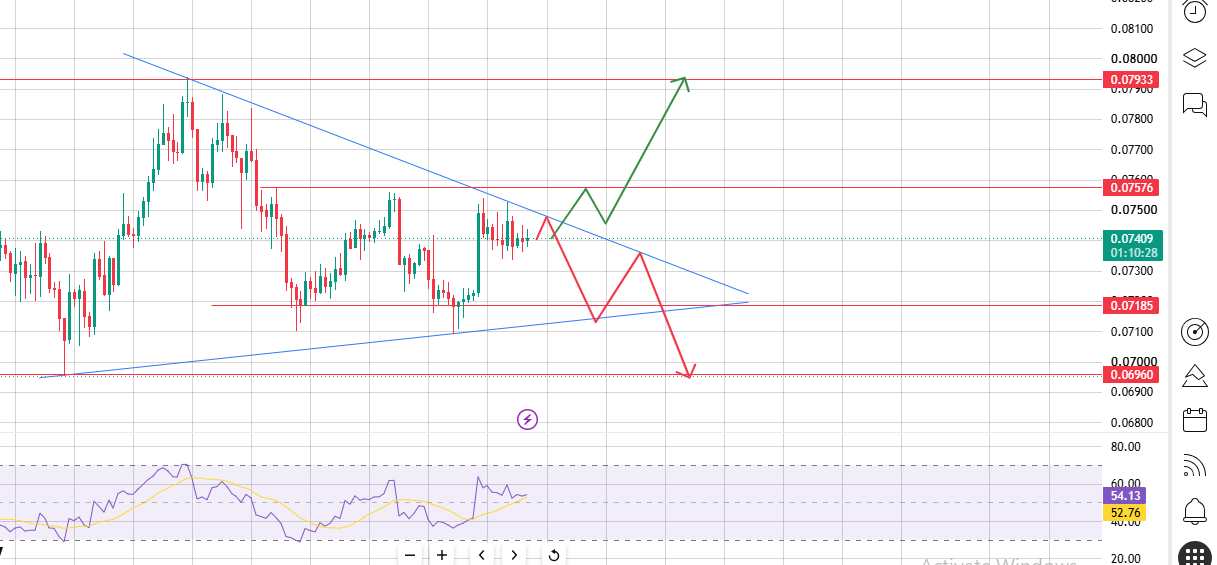
There are usually two breakouts for this pattern: if the price breaks and closes above the upper trend line, it tends to move towards highs around $0.07576 and $0.07933; if the breakthrough fails and the price turns below the lower trend line, it may fall to $0.07185 and then to $0.0696. The 4-hour RSI is close to 54 and the moving average is close to 52.76, both slightly above neutral levels and an improvement from the daily chart, but neither confirmed which side of the triangle DOGE will break through to.
What is the daily chart's indication of dog coin price forecast?
From the daily time frame, DOGE fell sharply in the downtrend channel, with the RSI close to 41 and the moving average close to 38, both lower than the neutral 50 line, which is still biased towards bearish rather than confirming a reversal. 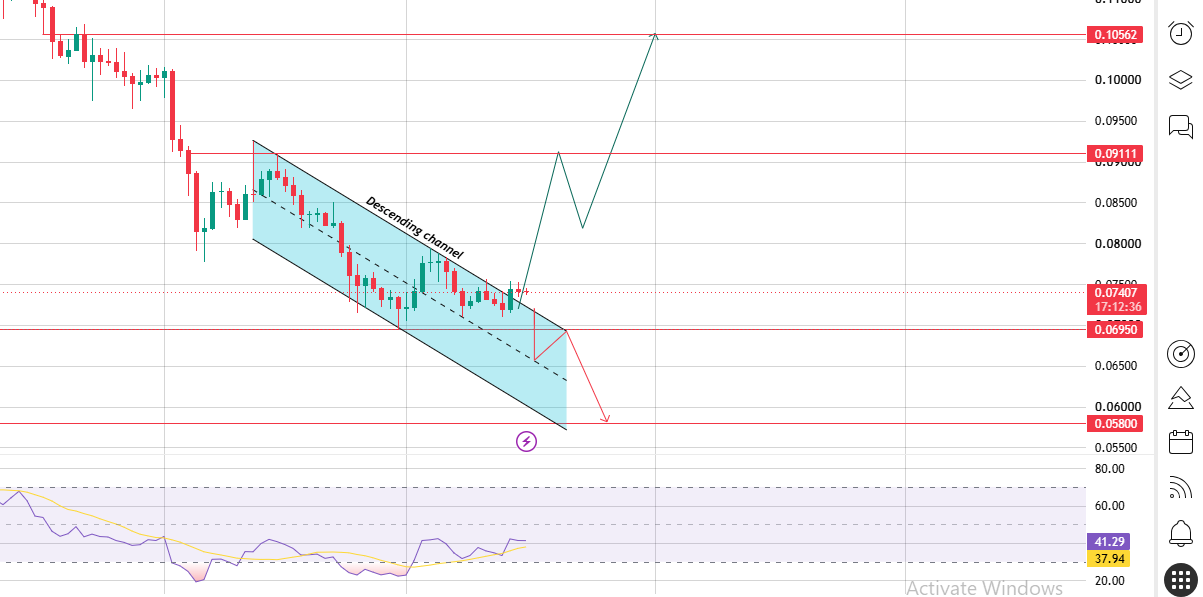
The chart structure shows that if the channel remains, the downside targets are $0.0695 and $0.0580; to change this situation, the price needs to recover $0.09111 and $0.10562.
What are analysts 'views on the price forecast of dogcoin?
Part of the opinions of this dogcoin price forecast come from analyst Trader Tardigrade, who posted on the X platform under the account TATrader_Alan. 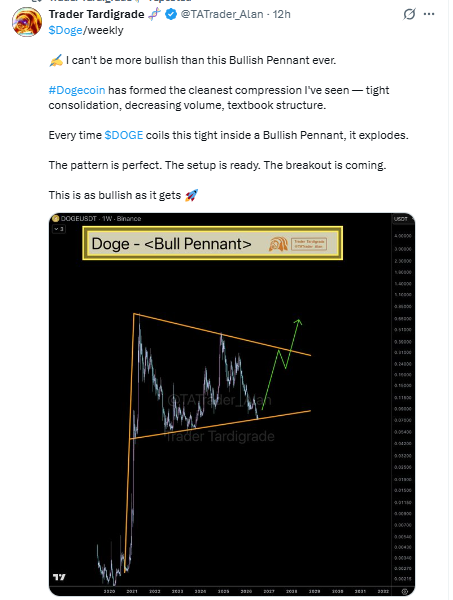 On the weekly chart, the analyst believes DOGE is forming a bullish pennant pattern. He pointed out that tight consolidation and shrinking trading volumes are textbook-like patterns that have historically often heralded breakthroughs for the token, but the post did not give a clear price target.
Bullish vs bearish
Bullish scenario: If the 4-hour compression breaks through upwards and DOGE breaks through US$0.07576 and US$0.07933 respectively, then the weekly pennant pattern pointed out by Trader Tardigrade will gain support, opening the channel for US$0.09111 and even US$0.10562 on the daily chart.
Bear scenario: If it breaks below US$0.07185 and US$0.0696, the daily downtrend will continue, and given that bulls have absorbed most of the liquidations in the past day, a new round of decline may trigger another wave of long liquidations until US$0.0580 comes into view.
Traders 'quick reference to
DOGE compresses roughly between US$0.0696 and US$0.07933 on the 4-hour chart, while the daily structure remains pointing downward to US$0.0580 unless the price recovers US$0.09111. This dogcoin price forecast remains divided between different time frames until one of them is confirmed.
Expert Opinion
Experts who analyze the current pattern generally point out that contradictions between different time frames are a feature of the current stage. The four-hour compression and a moderate improvement in the RSI support a short-term rebound, but daily charts have yet to confirm a trend shift and liquidation data shows bulls are still bearing the bulk of the losses. Traders are closely watching the $0.07185 support and the $0.07933 resistance level, which are most likely to determine the near-term direction.






















