
 Exchange Ranking
 Top Exchanges
 24h Volume Ranking
 Popularity Ranking
 Exchange BTC Balance
 Proof of Reserves
 Decentralized Exchanges
 Funding Rate
 Funding Heatmap
 Liquidation Data
 Max Pain
 Long/Short Ratio
 Whale L/S Ratio
 Binance/Okex/Huobi L/S
 Bitfinex Margin L/S
 ETF Tracker
 Solana ETF
 XRP ETF
 Hong Kong ETF
 Bitcoin Treasuries
 Crypto Reversal
 Ethereum Reserves
 HyperLiquid Wallet Analysis
 Hyperliquid Whale Watch
 Large Transactions
 On-chain Movement
 Bitcoin ROI
 Stablecoin Market Cap
 Options Analysis
 News
News Articles
 Economic Calendar
 Features
 Wallet
 Contract Calculator


 Security
 Collections
 Watchlist
 Following
 BTC
BTC  DOGE
DOGE  PEPE
PEPE  SHIB
SHIB $SHIB is quietly brewing a trend worthy of attention, and most chart browsing people are likely to miss it. This Shiba Inu price forecast will provide a detailed analysis of the current pattern and why the next few K lines are more important than usual.
Where SHIB is currently located
$SHIB is currently trading at approximately US$0.0000419, up about 1% after hitting a low of US$0.0000414. The listed value of the chain is close to US$4.18 billion, while the circulating market value is closer to US$2.46 billion, which reminds us that the overall supply of SHIB and its actual tradable liquidity are two different numbers. The level below reflects this snapshot; if prices significantly break either boundary, these numbers should be considered as requiring a refresh.
Shiba Inu News: Emotional Perspective
This week, a widely circulated Shiba Inu Final community message-style post summarized the views of two AI models on $SHIB. Both pointed out that the increase will be moderate rather than explosive by the end of 2026, and regarded community power as SHIB's biggest asset, while noting that Shibarium adoption has not yet proven powerful enough to drive a major breakthrough. 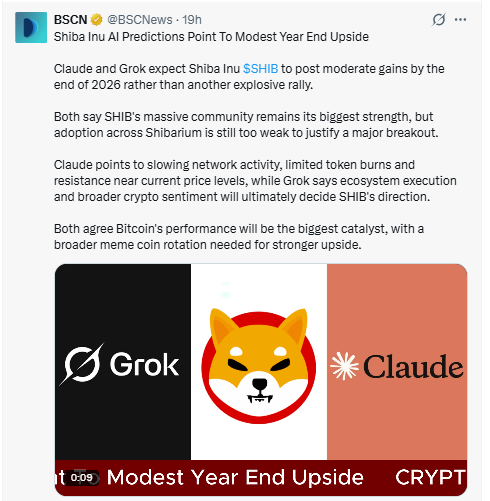
One model points to slowing network activity and limited destruction near current levels; another model attributes the direction more to ecological execution and broader market sentiment. Both believe that Bitcoin's performance is the biggest external catalyst. Please regard this as background information rather than confirmation of the technical form.
Shiba Inu Whale Activity
Anyone asking "Will Shiba Inu go up?" Everyone should look away from the chart and see who is holding it. The top 100 wallets controlled 83.15% of the supply, and the whale concentration reached 94.46%. Whale-level wallets only account for 0.04% of the total number of holders, but control almost all of the value. The Gini coefficient is 0.9957, and only seven wallets each hold at least 1% of the supply. 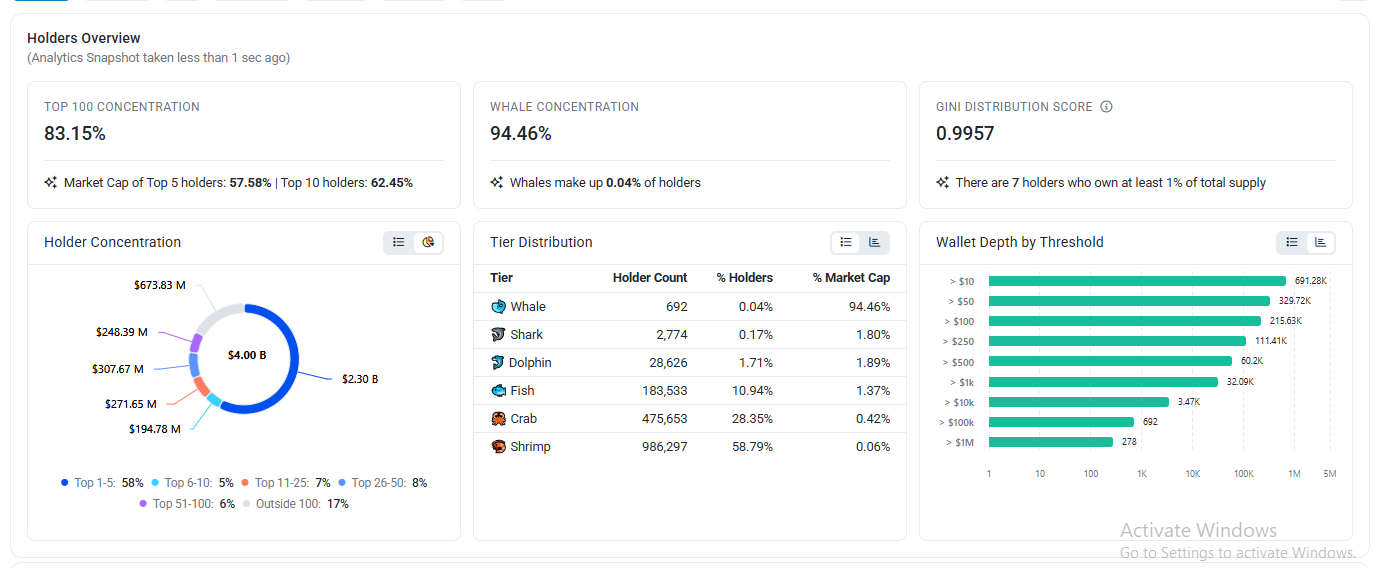
More than 1.6 million small wallets (fish, crab, and shrimp levels) have a total share of less than 2%. This explains why SHIB can fluctuate violently with low volume, and why trend-line breaks here can move quickly in either direction.
4-hour chart: Restricted in the downcomer channel
On the 4-hour chart,$SHIB is in the downcomer channel, with a price close to US$0.0000420 and at the 0.618 Fibonacci retracement level Between ($0.00000426) and the 0.786 Fibonacci retracement level ($0.0000417)-too close to the bottom of the channel to be strong; too close to the resistance level to be weak.
Recovering US$0.0000426, the next stop will be the US$0.0000442 - 0.0000460 area. If the bottom of the channel is lost at $0.0000405, there will be little support until the price reaches $0.0000371 (the same level noted on the daily chart).
4-hour level
Price: US$0.00000460, Importance: Upper Boundary of Channel
Price: US$0.0000426, Importance: 0.618 Fibonacci retracement
Price: US$0.0000405, Importance: Bottom of the channel 1.0 Fibonacci level
Price: 0.0000371, Importance: 1.618 Fibonacci expansion
Can SHIB rise to US$1?
Shiba Inu's predictions of reaching US$1 are endless, but they are not mathematically true. The circulation supply is approximately 588 trillion coins; at $1 per coin, the market value will reach $588 trillion-more than five times global GDP and greater than the combined market value of all listed companies. A more realistic ambitious goal is US$0.0001, which itself requires a more than 20-fold increase, corresponding to a market value of US$58 billion. This is still a high requirement, but at least within the range that cryptocurrencies have achieved in the past.
Daily Chart: Touching the downtrend line
The SHIB has been running for weeks below a downtrend line that has so far suppressed every rebound, and prices have now rebounded from below to hit the trend line, confined to a tight consolidation range rather than forming a clear breakthrough.
The $0.0000404 line at the bottom of the range is the most important area of support; it has held on every retest but has not yet faced real pressure. If the daily closing price can continue to stand above the trend line, it will open the first price target of US$0.0000524. If momentum continues, it will look towards US$0.0000557. If the breakthrough fails, or US$0.0000404 falls first, the next level is US$0.0000370-this is the 1.618 Fibonacci extension based on the previous volatility.
Daily Level
Price: US$0.00000557, Importance: Extended bullish target
Price: US$0.00000524, Importance: Trend line breaks target
Price: US$0.00000404, Importance: At the bottom of the consolidation range, being tested
Price: US$0.0000370, Importance: 1.618 Fibonacci Expansion, Bear Target
SHIB vs. other large-cap Meme coins
SHIB: The pattern is downtrend channel + trend line, with key support of US$0.0000404/0.0000405, difference point: deflation through destruction
DOGE: The pattern is Fibonacci retracement + trend line, the key support of 100% retracement area, difference point: fixed annual circulation
PEPE: The pattern is range volatility, the key support for previous demand area, difference point: Full dilution immediately after launch
Price Scenario
Bullish Breakthroughs: The trigger condition is that the daily closing price is above the trend line/the 4-hour chart recovers US$0.0000426, and the target is 0.0000524 → US$0.0000557
Neutral: The price remains in the range of US$0.0000404 - 0.0000426, and continues to fluctuate
Bear collapse: The triggering conditions are a loss of US$0.0000404 on the daily line/a loss of US$0.0000405 on the 4-hour chart, and a target of US$0.0000370
What will expire?
Just a shadow crossing US$0.0000524 or US$0.0000404 does not confirm anything; this analysis requires a full daily or 4-hour closing price to break through these levels.$ SHIB is a high-beta and emotion-driven breed, so a sudden shift in BTC's dominance could quickly cover the technical side, and given the whale concentration described above, a large shadow line could well appear without a real trend change.
Glossary
Fibonacci retracement/extension: The level used to estimate the position of a pullback to pause or extend. Descending channel: A downward trend defined by two parallel descending lines. Whale concentration: Proportion of supply held by the largest wallet.
Final Outlook
According to market analysts, the short-term direction of SHIB boils down to a test: Will the daily trend line eventually be breached, or will prices be suppressed again? Ethereum correlation and broader risk appetite are also important, as SHIB tends to move in the same direction as the entire Meme coin sector. If Bitcoin remains stable and the trend line breaks through with a true close, then $0.0000524 and $0.0000557 will enter range. If it is rejected again and $0.0000404 is lost, the next target is $0.0000370. SHIB is sitting right at the critical point in deciding which scenario to play out.






















