
 Exchange Ranking
 Top Exchanges
 24h Volume Ranking
 Popularity Ranking
 Exchange BTC Balance
 Proof of Reserves
 Decentralized Exchanges
 Funding Rate
 Funding Heatmap
 Liquidation Data
 Max Pain
 Long/Short Ratio
 Whale L/S Ratio
 Binance/Okex/Huobi L/S
 Bitfinex Margin L/S
 ETF Tracker
 Solana ETF
 XRP ETF
 Hong Kong ETF
 Bitcoin Treasuries
 Crypto Reversal
 Ethereum Reserves
 HyperLiquid Wallet Analysis
 Hyperliquid Whale Watch
 Large Transactions
 On-chain Movement
 Bitcoin ROI
 Stablecoin Market Cap
 Options Analysis
 News
News Articles
 Economic Calendar
 Features
 Wallet
 Contract Calculator


 Security
 Collections
 Watchlist
 Following
 TRUMP
TRUMP TRUMP has just made one of the fiercer trends for some time. This official TRUMP price forecast will discuss whether this is the starting point of a new round of market prices or a rebound in a long-term downward trend. The following is what the current daily line, 4-hour chart, clearing data, position concentration and exchange volume show, as well as the conditions that can truly confirm this trend.
TRUMP's current location
As of July 18, 2026, the price of TRUMP is approximately US$1.65. The market value is approximately US$1,654,998,480.62, and the circulation supply is approximately 999,999,082 tokens.
There are subtle differences between data sources in terms of 24-hour changes: Market Overview data shows an increase of +7.82%. 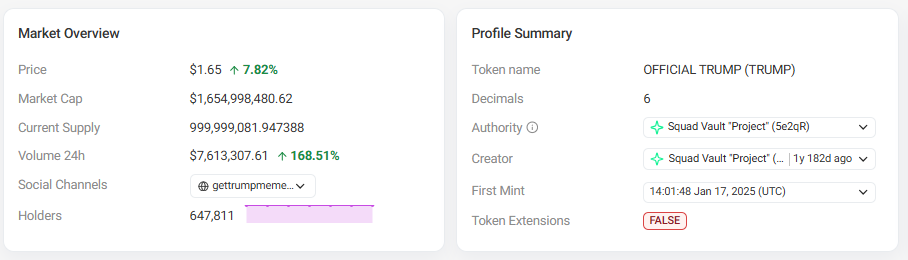 The daily candle chart on the OKX chart shows an increase of +6.76%. This is due to the fact that the data is taken from different platforms and is not an abnormal signal. Just pay attention to it.
One noteworthy statistic is that 24-hour trading volume surged 168.51% to US$7,613,307.61, indicating that the rise was accompanied by real participation rather than a weak low-volume drift.
The token currently has 647,811 holders, and the first minting date is January 17, 2025. The levels below are based on current snapshots; if prices significantly exceed either boundary, please consider the relevant data as requiring an update.
TRUMP Clearing: A Complex Situation Interwoven with Long and Short Opportunities
According to the Coinglass clearing data panel referenced in this article (data as of July 18, 2026), TRUMP's clearing situation shows a truly long-short and two-way characteristic, rather than a thorough cleaning in a single direction.
A total of US$27,270 was cleared in the past hour, most of which came from short positions in the amount of US$24,300. Within four hours, the liquidation total rose to $101,150, with bulls ($48,560) and bears ($52,590) almost evenly divided. 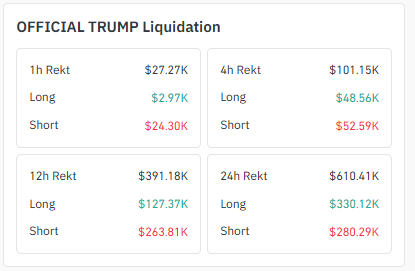 Within 12 hours, the short positions suffered a greater blow, with a liquidation amount of US$263,810 and the long positions of US$127,370, totaling US$391,180. During the full 24 hours, the pattern reversed slightly, with a larger liquidation of long positions at $330,120 and short positions at $280,290, totaling $610,410.
Overall, the market has punished both long and short sides in different time windows, which is consistent with the current sharp trend line rebound. Shorts were squeezed as prices pulled rapidly from the trend line, and some chasing bulls were subsequently expelled.
Exchange volume heat chart: OKX and Binance lead
According to the exchange volume heat chart referenced in this article (futures volume, data as of July 18, 2026), OKX accounted for the largest proportion of TRUMP futures volume, at US$80 million. Binance followed closely with $78.37 million; the two exchanges together accounted for the vast majority of total activity. 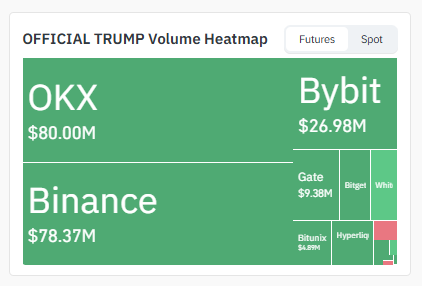 Bybit is far behind with $26.98 million, with Gate ($9.38 million) and Bitunix ($4.89 million) forming a smaller echelon. Bitget, WhiteBIT and Hyperliquid accounted for the remaining volume with smaller amounts. Since OKX and Binance's volume shares are very close, a real breakthrough should be reflected in both exchanges, rather than just one.
TRUMP whale position concentration: extremely highly concentrated markets
Anyone who questions TRUMP's ability to maintain this trend should carefully review its position structure.
According to the Solscan Chain Position Analysis Panel referenced in this article (data as of July 18, 2026), the top 10 wallets alone control 90.25% of supply, with a value of approximately US$1.49 billion. 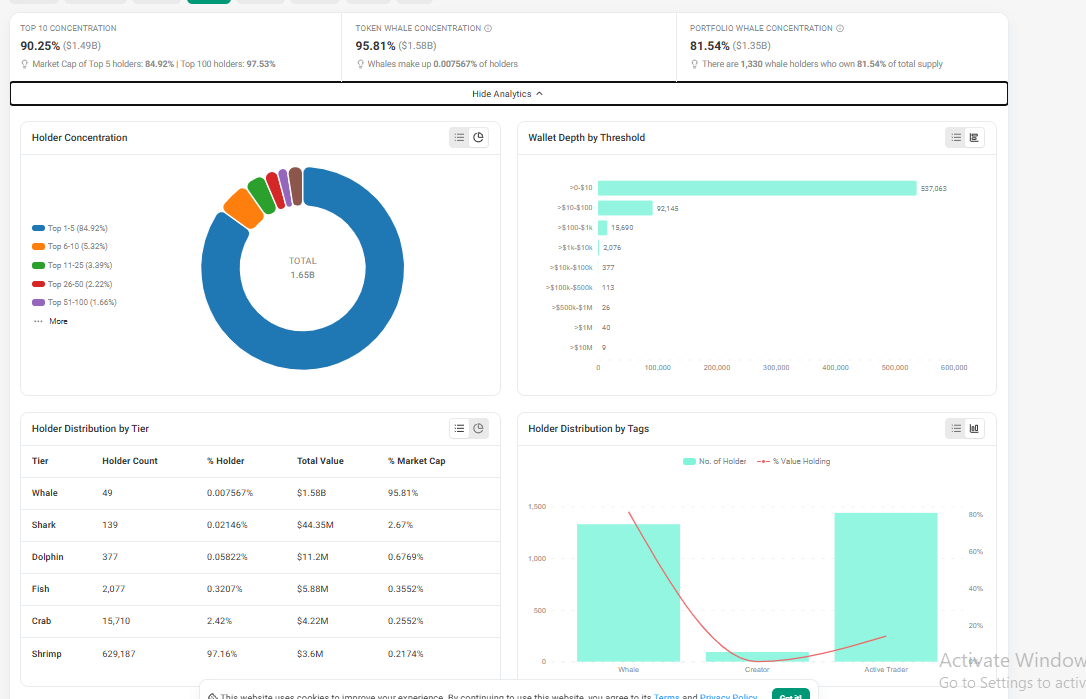 The concentration of whale positions at the token level reached an extreme of 95.81%. Whale-level wallets only account for 0.007567% of all holders, but control almost all of the value.
By number of wallets (rather than token contracts), 1,330 whale wallets hold 81.54% of the total supply.
Breakdown by tier: Only 49 whale wallets hold 95.81% of the market value, while the shrimp tier-629,187 wallets, accounting for 97.16% of all holders-holds only 0.2174% of the value in total.
This concentration is more extreme than most large-cap meme tokens, which means today's rally may be driven by a very small number of wallets and is equally easily reversed by those wallets. For TRUMP, breakthroughs confirmed with strong volume on multiple exchanges (see above) have more weight than for more evenly distributed tokens.
Official Trump Forecast: 4-hour chart analysis
The 4-hour chart more clearly shows the mechanism of this rebound.$ TRUMP consolidated in a narrow range for some time before breaking through upwards and is currently trading at around $1,640, just above the previous bottom. 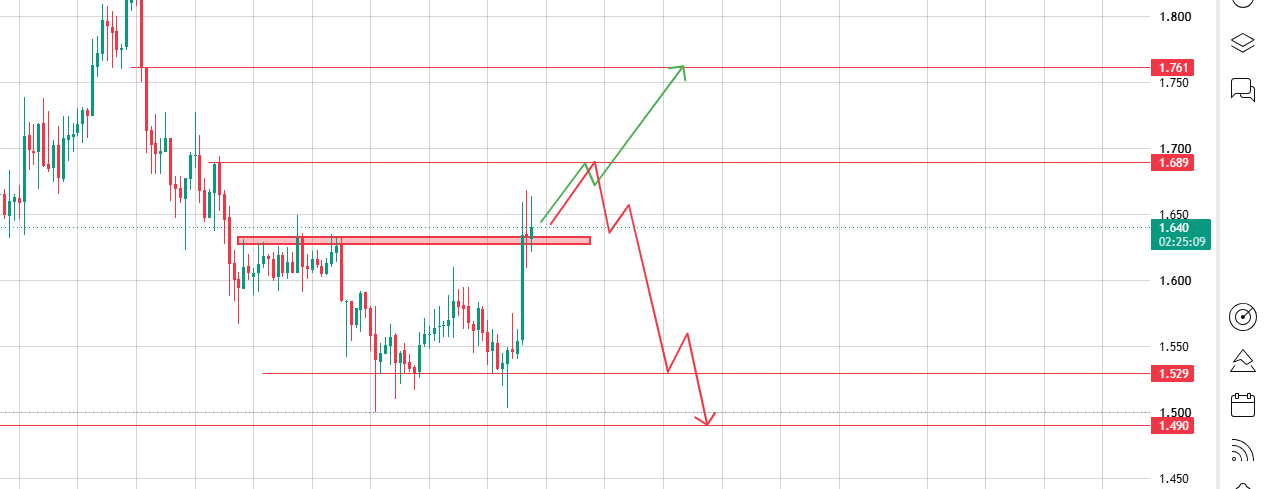 The direct resistance level is US$1.689. If this level is exceeded, the next target is US$1.761.
On the downside side, US$1.529 is the first support level to pay attention to, and US$1.490 near the top of the old consolidation range is deeper support. If this breakthrough takes back gains, this level will play a role.
4H Level:
Price:
Importance:
Resistance level 2: US$1.761, extended target after breakthrough
Resistance level 1: US$1.689, direct resistance
Support level 1: US$1.529, directly supporting
Support level 2: US$1.490, old consolidation range, deeper support
Official Trump Price forecast: Daily chart rebounds from trend line
On the daily chart, TRUMP has slipped below a downtrend line for several weeks, and now it is at that trend line where there is a sharp rebound. Here's the key detail: This is not a random positive line, but a response at a specific level that has been previously respected, which has more weight than a rebound that occurs in an open area. 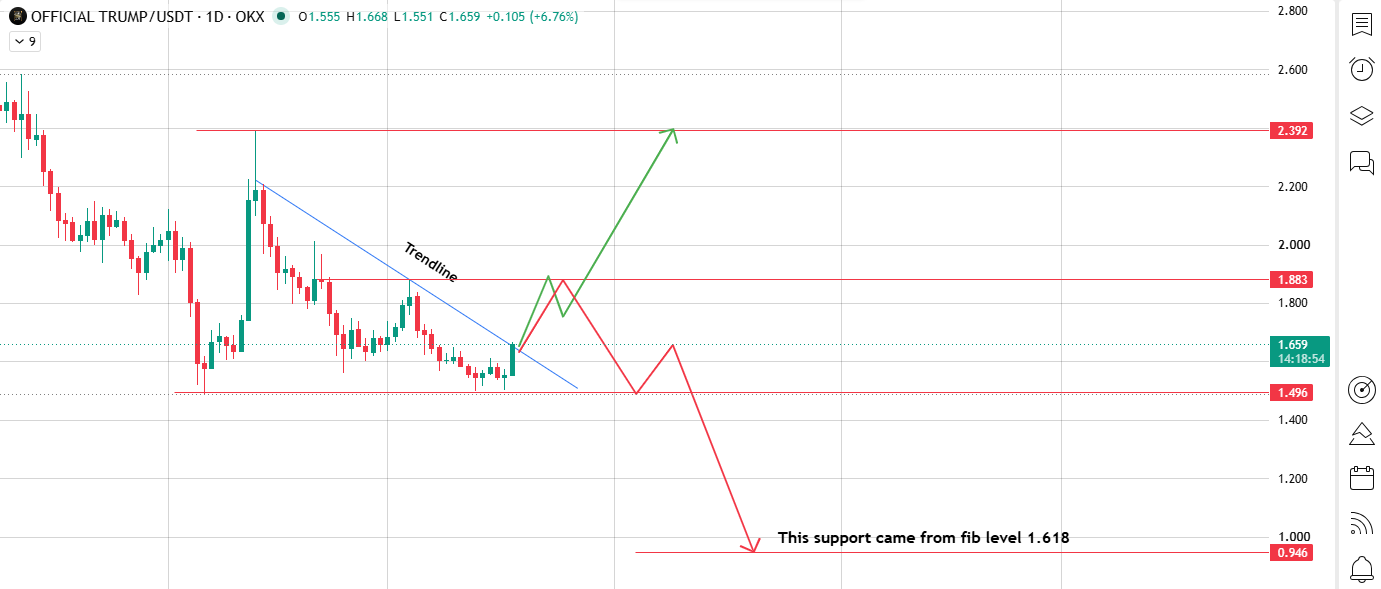 If TRUMP holds above the trend line and continues to rise, the first target is $1.883. If this level is exceeded driven by continued momentum, US$2.392 will come into view, which will be a major increase at the current level.
If the rally fails and prices fall below the trend line again, the first support level is focused on $1.496, and the deeper target level of $0.946 is taken from the 1.618 Fibonacci expansion.
1D Level:
Price:
Importance:
Resistance level 2: US$2.392, extended bullish target
Resistance level 1: US$1.883, key target if the rebound continues
Support level 1: US$1.496, direct support if rebound fails
Support level 2: US$0.946, 1.618 Fibonacci expansion, deeper bearish target
TRUMP price scenario: bullish, neutral, bearish
Daily chart (trend line rebounds):
Scenario: Trigger condition, price target
Bullish breakthrough: Daily closes above the trend line, US$1.883 → US$2.392
Neutral/range shocks: Prices are stable near the trend line, no further follow-up, and continue to consolidate
Bear break: Daily closed below trend line again/fell below $1.496,$1.496 → $0.946
4-hour chart (fresh break):
Scenario: Trigger condition, price target
Bullish break: 4-hour close broke through US$1.689, US$1.689 → US$1.761
Neutral/range volatility: The price remained stable between US$1.529 and US$1.689, continuing to consolidate
Bear broke below: 4-hour close fell below US$1.529, US$1.529 → US$1.490
bearish situation: What would deny this pattern
briefly piercing any of the above levels is not enough to confirm any signal; This pattern requires a complete daily line or 4-hour candle line to close above the trend line, rather than just intraday touches. In addition to the usual BTC dominance and ETH related risks, there are two factors worthy of pointing out specifically at TRUMP:
Whale-driven reversal: Given the very small number of wallets controlling the value of the token, profit-taking by a few large players in this rally could quickly erase gains, no matter how the chart shape suggests.
Two-way clearing risk: Since both long and short sides have been squeezed at different points in the past 24 hours, prices may sharply pierce any level, but it does not represent a real change in trend.
Glossary
Trend line: A line connecting a series of price highs or lows, used to visualize the direction and slope of the trend.
Fibonacci extension: A level used to estimate how far prices may extend after previous swings.
Liquidation: Forced liquidation of leveraged positions when losses exceed available margin.
Concentration of whale positions: Proportion of total supply held by the largest wallet.
Methodology
The prices and chart levels in this official Trump price forecast are read directly from the daily (OKX) and 4-hour (Binance-style) charts on TradingView, with the screenshot dated July 18, 2026. The clearing data comes from the clearing tracking panel, the futures volume data comes from the exchange volume heat chart, and the position concentration data comes from the chain position analysis panel. All data are as of July 18, 2026. No levels in this article are extrapolated. Beyond what these sources show, all price levels should be reconfirmed via real-time charts before release, as cryptocurrency prices can change significantly within hours.
Final Outlook: TRUMP needs to hold on to the trend line, not just hit
According to market analysts at Coingabbar, TRUMP's next move depends on whether this trend line rebound truly stabilizes or falls back below the trend line as previously tried. Mixed clearing data suggests that both long and short sides have been hit in the past 24 hours, and since OKX and Binance bear most of the volume, the real follow-up should be clearly evident on these two exchanges. Given the high concentration of positions, this is a pattern that requires confirmation signals more than usual:
holds above the trend line with real trading volume, and US$1.883 will enter the target range; if it falls again, focus on US$1.496.
The cryptocurrency market is extremely volatile. This article is for information reference only and should not be regarded as financial advice. Before making an investment decision, be sure to study it yourself.
Disclaimer : This document is for informational and educational purposes only and does not constitute financial advice. The cryptocurrency market is extremely volatile. Please do your own research and consult a licensed financial adviser before making any trading or investment decisions.






















