
 Exchange Ranking
 Top Exchanges
 24h Volume Ranking
 Popularity Ranking
 Exchange BTC Balance
 Proof of Reserves
 Decentralized Exchanges
 Funding Rate
 Funding Heatmap
 Liquidation Data
 Max Pain
 Long/Short Ratio
 Whale L/S Ratio
 Binance/Okex/Huobi L/S
 Bitfinex Margin L/S
 ETF Tracker
 Solana ETF
 XRP ETF
 Hong Kong ETF
 Bitcoin Treasuries
 Crypto Reversal
 Ethereum Reserves
 HyperLiquid Wallet Analysis
 Hyperliquid Whale Watch
 Large Transactions
 On-chain Movement
 Bitcoin ROI
 Stablecoin Market Cap
 Options Analysis
 News
News Articles
 Economic Calendar
 Features
 Wallet
 Contract Calculator


 Security
 Collections
 Watchlist
 Following
 SOL
SOL  PUMP
PUMP PUMP has risen more than 21% in the past week and is currently trading around $0.00178. The 4-hour chart has completed the head, shoulders and bottom shape, and has touched the measurement target position. The daily chart remains below the 200-day moving average and is in a downward trend since January 28. Pump.fun continues to sell SOL in platform fee revenue, with cumulative sales reaching nearly US$801 million.
The PUMP token is associated with the Memecoin launch platform of the same name on the Solana chain. As of the time of writing, the transaction price was approximately US$0.00178. It has increased by more than 21% in the past seven days and has increased by more than 45% from the low of US$0.001223 set on June 26. The rally pushed prices past the neckline of the head-and-shoulder pattern on the 4-hour chart and achieved the measurement target for that pattern; however, on the daily chart, PUMP is still below the 200-day moving average, in a downward trend since the January 28 cyclical high of $0.003362. The market value of the token is approximately US$707 million.
Head and shoulder pattern, target has been achieved
The left shoulder was formed at around US$0.0014 on June 17, and then the head was formed at US$0.001223 on June 26, the deepest point of the correction and the token's cyclical low. The right shoulder was formed between June 29 and July 1, almost the same as the $0.0014 level, completing the symmetry of the shape.
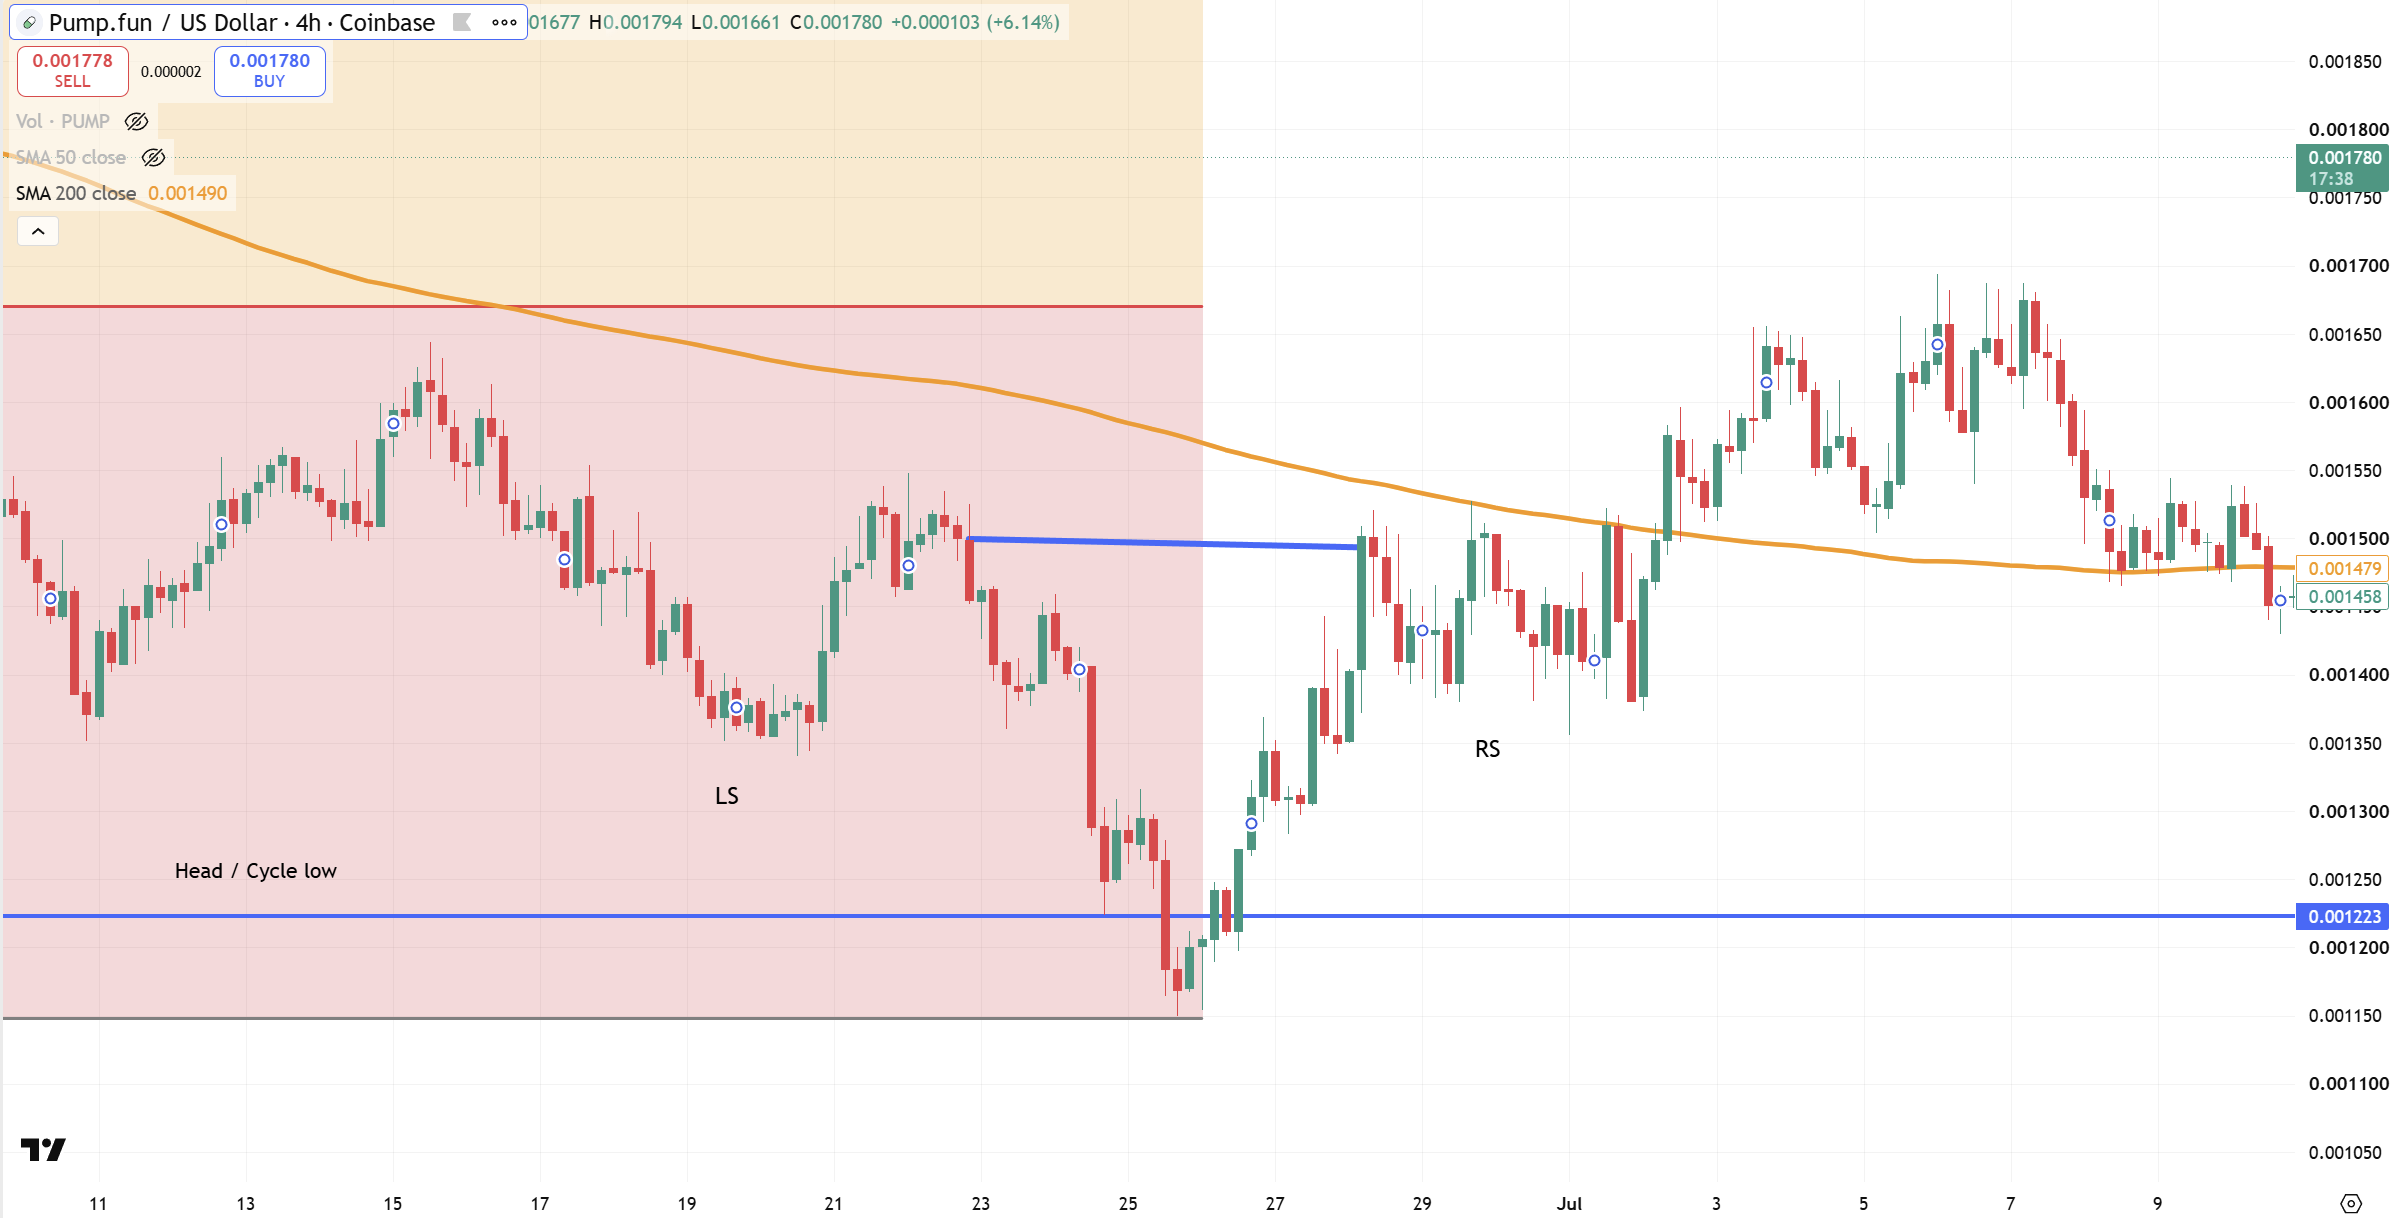
Chart analysis: Alexander Stefanov (@alexandertradeniws)
The neckline is located between two reaction highs on either side of the head, about $0.0015, and the price decisively closed above that level in early July. The measurement target, calculated by projecting upward the distance between the neckline and the head, points to approximately $0.00178, a level that PUMP has currently reached and slightly exceeded. The 50-cycle moving average over this time frame has exceeded the 200-cycle moving average during the rebound, and the 14-cycle RSI is at 69.86, close to but not yet fully entering the overbought area.
Zoom in on the field of vision, and the trend is still downward.
Zoom in on the field of vision, and the situation is very different. PUMP's daily cyclical high hit US$0.003362 on January 28, and subsequent declines formed a low on June 26, with a slightly lower daily level of approximately US$0.00115. A downtrend line connecting the January high to lower highs from March to May has not yet been breached, suppressing prices.
Chart analysis: Alexander Stefanov (@alexandertradenews)
A Fibonacci retracement analysis of the decline from January to June showed that the 23.6% level was at US$0.001671 and had recovered. The next test is at the 38.2% retracement level of $0.001994, which almost coincides with the 200-day moving average of $0.001909. The 50-day moving average, at $0.001517, has been recovered, while the 200-day moving average is still above current prices. The broader trend in this time frame remains bearish on the technical side. The daily RSI reading was 63.27, above its own moving average of 53.13 and above the neutral 50 line.
Breakthrough or turning point in this round of rally
Three different technical analysis tools now point to the same upper resistance band: the wider 4-hour head and shoulder target at approximately $0.00199, the daily 38.2% Fibonacci retracement level at $0.001994, and the daily 200-day moving average of $0.001909. If the closing price breaks through that zone, PUMP will reach its 200-day moving average for the first time since the January-June decline began, arguably the more meaningful technical milestone of the two, as the short-term pattern has achieved its goal.
Time frame: 4 hours| Level: Head/Cycle Low| Price: $0.001223| Status: June 26
Time frame: 4 hours| Level: Neck line| Price: ~$0.0015| Status: Breakthrough, above the close
Time frame: 4 hours| Level: Measurement goal| Price: ~$0.00178| Status:
Touched Time frame: 1 day| Level: Cycle high| Price: $0.003362| Status: January 28
Time frame: 1| Level: Cycle lows| Price: ~$0.00115| Status: June 26
Time frame: 1| Level: 23.6% Fibonacci| Price: $0.001671| Status: Recovered
Time frame: 1 day| Level: 38.2% Fibonacci| Price: $0.001994| Status: Next resistance level
Time frame: 1 day| Level: 50-day moving average| Price: $0.001517| Status: Recovered
Time frame: 1 day| Level: 200-day moving average| Price: $0.001909| Status: Still above
Failure to break through that area will make the rally more like a strong rally within a full downtrend. The reversal has not yet been confirmed. The real test will come when prices approach $0.0019 to $0.002 in the next few trading days.
SOL sales behindLookonchain quoted Arkham data and reported on July 18 that pump.fun once again transferred and sold 81,711 SOL units, bringing cumulative sales since the platform was launched to 4,738,536 SOL units, with an average price of US$169 per unit.
Pump fun(@Pumpfun) sold another 81,711 SOL units (worth US$6.15 million) today! In total, 4,738,536 SOL units (valued at approximately US$800.96 million) have been sold, with an average price of US$169 each. -- Lookonchain (@lookonchain) July 18, 2026
It is necessary to distinguish the pump.fun platform from the PUMP token itself. Fees earned by the platform from token creation, binding curve trading, and migration to PumpSwap are accumulated in the form of SOL (Solana's native asset) rather than PUMP, so deposits to exchanges such as Kraken directly affect SOL supply rather than PUMP. This practice has continued since early 2024.
Indicator: SOL sold on July 18| Value: 81,711 SOL (approximately US$6.15 million)
Indicator: Cumulative sales since 2024| Value: 4,738,536 SOL
Indicator: Total Sales| Value: approximately US$800.96 million
Indicator: Average selling price| Value: US$169 per piece
In addition to these direct sales, pump.fun uses most of its revenue to repurchase the PUMP token itself, a mechanism introduced after the token was launched in 2025. Continued charging activity-as indirectly reflected in these weekly SOL sales-is often seen as indirect support for PUMP demand through the channel, although it is not directly related to specific transfers to Kraken.
Key Levels to Focus on
For holders and traders who are concerned about PUMP, the US$0.0019 to 0.002 region will be a reference point for the next few trading days. If the daily closing price is above US$0.001994 and the volume is above average, it will confirm a breakthrough of the 200-day moving average and open the way for the next Fibonacci level of 50% or US$0.002255. If blocked in this area, attention will turn back to the US$0.0015 to US$0.0017 area, which is the front neckline and the recovered 23.6% level, as potential support during the correction. The MACD line of the daily line is still above the signal line, with a positive histogram, and there is no sign of kinetic energy reversal. However, the combination of a near-overbought 4-hour RSI and a daily downtrend line that has not yet been breached requires caution before confirming a breakthrough in the resistance area.
Even a clean close above the US$0.0019 -0.002 region would only retract a little more than a third of the entire January-June decline. PUMP fell nearly 66% from a cycle high of $0.003362 to a cycle low of approximately $0.00115, and regained the $0.002 area only recovered a decline of approximately 38%. Even if it successfully breaks through the resistance band, the token will still trade nearly 40% below its January peak, reminding us that this week's rally has only repaired a small part of a larger decline rather than reversed it.






















