
 Exchange Ranking
 Top Exchanges
 24h Volume Ranking
 Popularity Ranking
 Exchange BTC Balance
 Proof of Reserves
 Decentralized Exchanges
 Funding Rate
 Funding Heatmap
 Liquidation Data
 Max Pain
 Long/Short Ratio
 Whale L/S Ratio
 Binance/Okex/Huobi L/S
 Bitfinex Margin L/S
 ETF Tracker
 Solana ETF
 XRP ETF
 Hong Kong ETF
 Bitcoin Treasuries
 Crypto Reversal
 Ethereum Reserves
 HyperLiquid Wallet Analysis
 Hyperliquid Whale Watch
 Large Transactions
 On-chain Movement
 Bitcoin ROI
 Stablecoin Market Cap
 Options Analysis
 News
News Articles
 Economic Calendar
 Features
 Wallet
 Contract Calculator


 Security
 Collections
 Watchlist
 Following
 BTC
BTC  ETH
ETH  SHIB
SHIB SHIB Price Forecast: Analysis of Market Trend
Whenever the trend of Shiba Inu coins calm down, the search volume for its price forecast will soar. At the moment, SHIB is in an extremely calm state. Prices have been sideways for some time, and the range has gradually narrowed. This pattern may seem to be silent, but in fact, there is an undercurrent. Destruction activities suddenly surged behind the scenes, with some large wallets moving, and chart indicators pointing to a nearby decision point. SHIB is about to rebound, or will it fall again first? This depends on which side of the key support or resistance line is breached. The following is the chart, liquidation data and the true situation revealed by the quantity destroyed.
Current Market Overview
Indicators| Value
Price| $0.00000415 (down 0.04% in 24 hours)
Market Value| $2.44 billion (-0.04%)
Current Market Value| $2.44 billion
24-hour trading volume| $45.79 million (+17.54%)
Volume/Market Value Ratio| 1.85%
Full Dilution Estimate| $2.44 billion
Liquidation Volume/Market Value Ratio| 0.15%
Total Supply| 589.49 trillion SHIB
maximum supply| 589.55 trillion SHIB
Circulation Supply| 589.24 trillion SHIB
Number of coin holding addresses| The price of 3.06 million
was barely moving today, but trading volume surged nearly 18%. When trading volumes rise and prices are flat, it usually means that there is an undercurrent under the surface.
Liquidation data: Long positions continue to be under pressure
Based on clearing data over the past 24 hours, one phenomenon is very prominent: short positions are almost untouched, while long positions are under most of the liquidation pressure in almost all time windows. 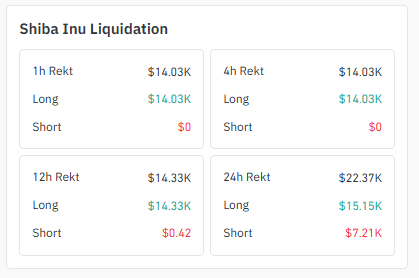
Time Range| Total liquidation amount| Long clearing| Short clearing
1 hour| $14,030 | $14,030 |$0
4 hours| $14,030 | $14,030 |$0
12 hours| $14,330 | $14,330 |$422
24 hours| $22,370 | $15,150 |$7,214
This figure is consistent with the characteristics of a downward triangle: market participants continue to try to buy the bottom too early, but are shaken out before the support level truly stabilizes.
Exchange trading volume heat map
According to the SHIB trading volume data of each exchange, trading activity is scattered among multiple platforms, but one exchange is significantly ahead: 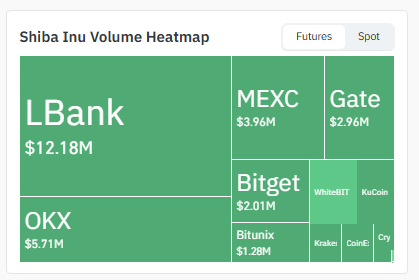
Exchange| 24-hour Contract Volume
LBank| $12.18 million
OKX| $5.71 million
MEXC| $3.96 million
Gate| $2.96 million
Bitget| $2.01 million
Bitunix| $1.28 million
In addition, WhiteBIT, KuCoin, Kraken, CoinEx and Crypto.com also have smaller transaction volumes. LBank alone accounts for nearly a quarter of total trading volume, a fairly concentrated trading venue for such a widely traded currency.
4-hour chart: Located at the triangular support level
The 4-hour chart shows a clear descending triangle: there is a flat support line at the bottom and a downwardly sloping resistance line above, the two gradually narrowing to form a smaller and smaller range. Currently, prices are almost right on the support line, around $0.0000415. 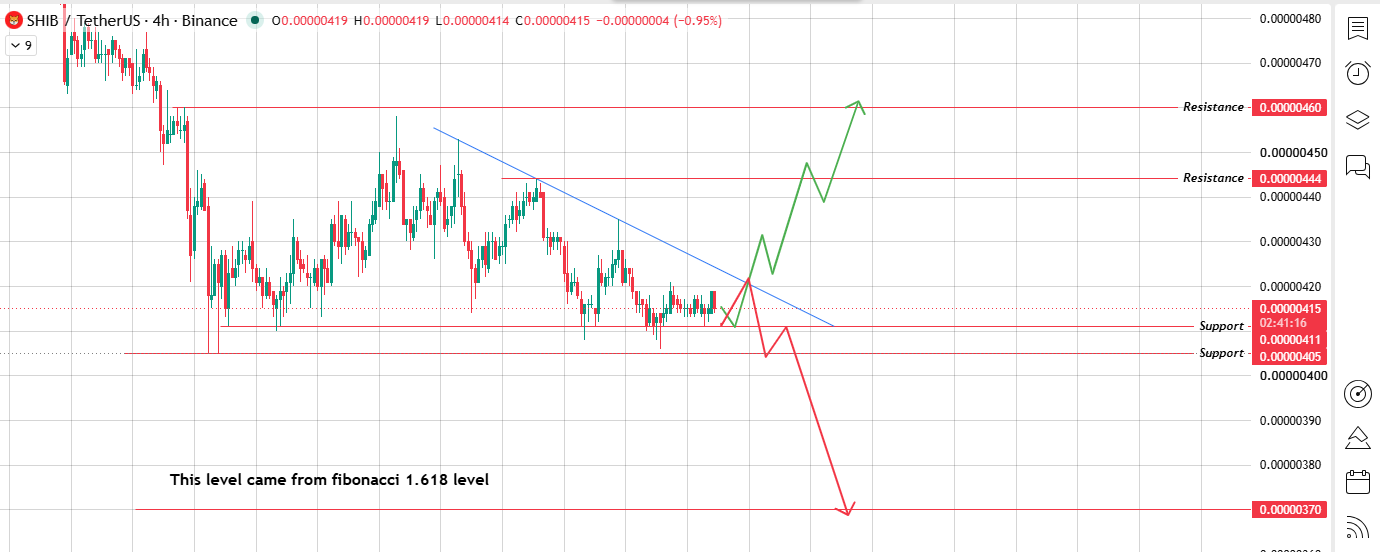
Resistance level: $0.0000444
Resistance level: $0.0000460
Support area: $0.00000411
Support area: $0.00000405
Fibonacci 1.618 decline target: $0.00000370
If prices break upwards from the upper trajectory of the triangle, it will constitute a bullish breakthrough and are expected to climb first towards $0.00000444, followed by $0.0000460. However, if the breakthrough fails to stabilize and the price falls back, a bearish break will be formed and may fall to $0.0000405. If selling pressure continues thereafter, the next target will be the Fibonacci target of $0.0000370.
Daily Chart: Trapped below the downtrend line
Stretch the perspective to the daily chart, and SHIB has been in the sideways consolidation range for some time. A downtrend line extending from the high point of the pattern is suppressing prices from above, trapping them within range. 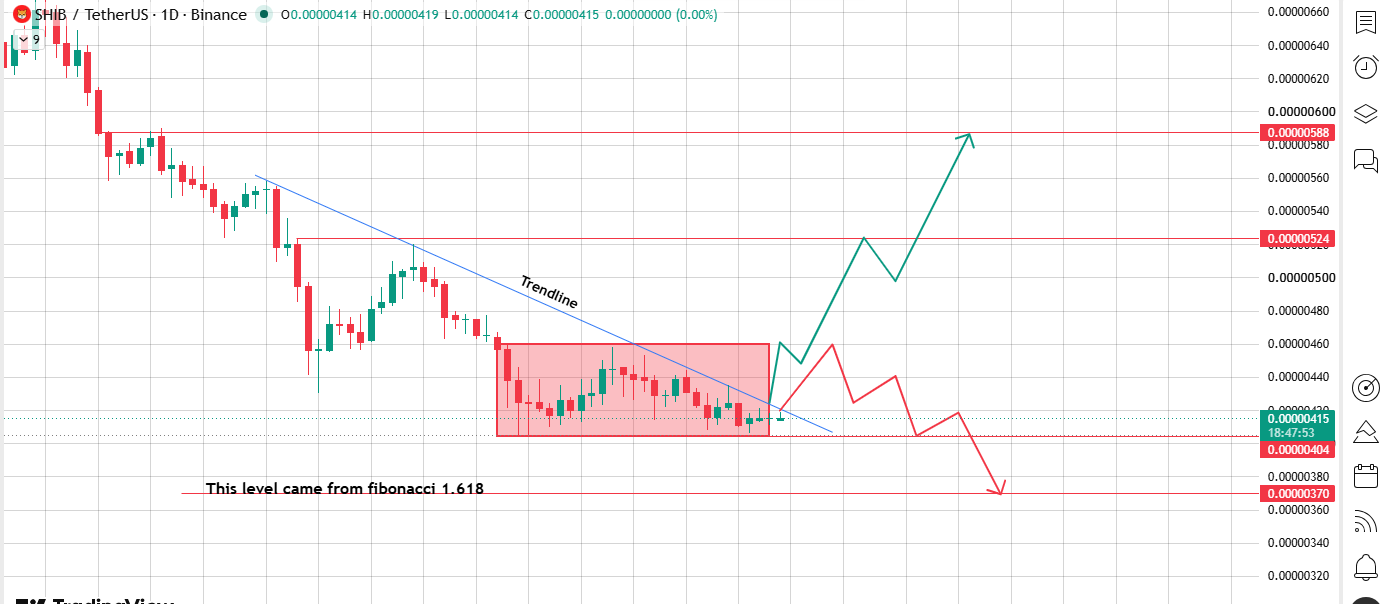
Long-term bullish break through resistance: $0.0000524 → $0.0000588
Long-term bearish break support area: $0.0000404 → $0.0000370
If SHIB can break through this downtrend line with a strong daily closing price, the next target to watch is $0.0000524. If momentum continues, it is expected to hit $0.0000588. Conversely, if the breakthrough fails, the price may first fall to $0.0000404 and then fall all the way to $0.0000370, which is the same as the Fibonacci target pointed to on the 4-hour chart. The two time periods resonate at the same downside target, making this price point a node worthy of close attention.
Three scenarios outlook
scenarios| Short-term (4-hour) goals| Long-term (daily) target
bullish| $0.00000444 → $0.00000460 | $0.00000524 → $0.00000588
Neutral/range oscillation| Located near the $0.0000415 support level| Consolidating between $0.00000404 and $0.0000419
Bear| $0.00000405 → $0.00000370 |$0.0000404 → $0.0000370
Market sentiment: surge in destruction and whale movements
Destruction tracker Shibburn released a noteworthy figure this week: 13,993,026 SHIBs were destroyed in 24 hours, worth approximately $57.62 at current prices. The daily destruction rate soared by 312.94%, a huge peak even by normal SHIB standards. 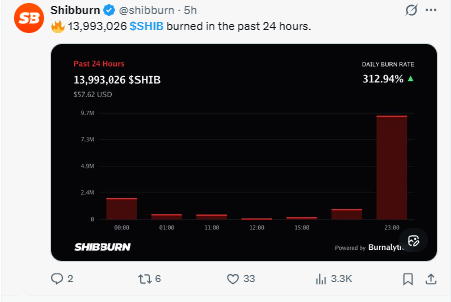
However, the key point is: Nearly 14 million tokens may sound considerable, but compared with the total supply of 589.24 trillion yuan, the amount destroyed on this day only accounted for about 0.000024%, which is almost negligible in the larger picture. Around these destruction peaks, Shiba Inu's whale activities tend to attract a lot of attention on social media. It is reasonable to focus on the movement of large wallets, but for now, the destruction itself has not reduced supply in a way that affects prices.
Can SHIB reach $1? Let's do some calculations
This issue is often mentioned. Rather than guessing, it is better to calculate it actually. The circulation supply of SHIB is 589.24 trillion pieces. If each piece is worth US$1, the total value of all SHIBs will reach approximately US$58.9 trillion. For comparison, global economic output is approximately US$105 trillion a year, while the total wealth of all assets on earth is estimated to be approximately US$454 trillion. When SHIB reaches 1 dollar, its value will exceed the sum of all the wealth on earth, and it will be several times more. This is not just a matter of small probability; given the current supply, it is mathematically impossible.
Even a smaller price target, such as 1 cent ($0.01), would require the total value of SHIB to reach approximately US$5.89 trillion, which exceeds the highest market value of any company or asset ever. For SHIB to have a real chance to hit higher prices, supply must be significantly reduced through destruction, much faster than current levels. At the current destruction rate, reducing the supply of 589 trillion yuan in tokens to a meaningful level will take an extremely long time. Therefore, a more realistic view of the possibility of SHIB reaching $1 should be viewed as a distant assumption that relies on supply shocks rather than the direction the current chart points.
Comparison of technical and emotional goals
Based on sources| time frame| Target Interval
4-hour Chart (Falling Triangle)| short-term| $0.0000370-$0.0000460
Daily Chart (Horizontal Arrangement)| medium-term| $0.0000370-$0.0000588
Destruction/Whale Emotions| Speculative/long-term| There is no fixed number depending on shrinking supply
The technical target range is clear and comes directly from chart analysis. Hope driven by destruction is a true story worthy of attention, but its evolution has a timeline completely different from the temporal dimension shown in the current chart form.
Background of Bitcoin dominance and Ethereum correlation
SHIB does not fluctuate completely independently. Changes in Bitcoin's dominance often determine how much money can flow into meme coins like SHIB. The correlation between SHIB and Ethereum means that the overall sentiment of mainstream currencies is usually reflected in their prices before news about SHIB itself emerges. When predicting the price of Shiba Inu, especially during the current calm period, these two factors are worth considering together.
Final Outlook
SHIB is at the triangular support level, while the daily level consolidation range continues to narrow above, which constitutes a clear "wait and see" pattern. There was a greater amount of long-term liquidations in the past day, indicating that the market has not yet chosen a direction. A truly trend market needs to close strongly above $0.0000444 in the short term, or stand above $0.0000524 in a longer period to turn into bullish expectations. Before then, if support breaks below, the range of $0.0000405 to $0.0000370 will be a downward area to pay attention to. The destruction surge and whale discussions are useful for understanding the overall market sentiment for Shiba Inu, but they are not a substitute for the current signals conveyed by the chart itself.
Glossary
Falling triangle: There is a flat support line at the bottom and a downward sloping resistance line above, and prices fluctuate within a gradually narrowing range over time. Once a breakthrough in a certain direction, it usually tends to be bearish.
Horizontal consolidation: Prices move back and forth within a narrow range, usually as the market waits for some catalyst to push it out of the range.
Resistance level and support area: Essentially two sides of the same concept: resistance level is the "ceiling" that the seller continues to stick to, and support area is the "floor" where the buyer continues to appear as a protective plate.
Liquidation heat chart: shows how leveraged transactions have been forcibly closed on each exchange and which party (long or short) has suffered the main loss.
Exchange trading volume: Simply put, it is the total trading volume of a currency on all online exchanges.
Two other key terms:
Bitcoin dominance: Refers to Bitcoin's share of the entire cryptocurrency market.
Ethereum correlation: refers to the degree to which the price trend of a certain currency is synchronized with the price trend of Ethereum.
Methodology
All key positions in the charts on Shiba Inu price forecasts in this article are directly derived from the uploaded 4-hour and daily TradingView charts, including the Fibonacci 1.618 target marked with both. All data are not guesses or additions. Clearing and exchange volume data comes from the real-time derivatives data panel, and destruction data comes from Shibburn's public tracker. The calculation of the market value of US$1 uses SHIB's current circulating supply and compares it with global wealth and GDP data. Reflects market conditions as of July 20, 2026. For information only and does not constitute financial advice.






















