
 Exchange Ranking
 Top Exchanges
 24h Volume Ranking
 Popularity Ranking
 Exchange BTC Balance
 Proof of Reserves
 Decentralized Exchanges
 Funding Rate
 Funding Heatmap
 Liquidation Data
 Max Pain
 Long/Short Ratio
 Whale L/S Ratio
 Binance/Okex/Huobi L/S
 Bitfinex Margin L/S
 ETF Tracker
 Solana ETF
 XRP ETF
 Hong Kong ETF
 Bitcoin Treasuries
 Crypto Reversal
 Ethereum Reserves
 HyperLiquid Wallet Analysis
 Hyperliquid Whale Watch
 Large Transactions
 On-chain Movement
 Bitcoin ROI
 Stablecoin Market Cap
 Options Analysis
 News
News Articles
 Economic Calendar
 Features
 Wallet
 Contract Calculator


 Security
 Collections
 Watchlist
 Following
 SHIB
SHIB The price of Shiba Inu is at risk of another sharp fall, and the short pattern is reappearing.
For most of 2026, Shiba Inu (SHIB) has been moving in the wrong direction, and the latest technical analysis shows that the pressure may not have ended yet. A new analysis points out that the current chart shape is very similar to a certain shape in 2023. If history repeats itself, SHIB prices could experience another significant decline before a stronger rebound has a chance to take shape.
Market updates show that the current price structure of SHIB looks surprisingly similar to the pattern formed in the second quarter of 2023. Shiba Inu lost its key support level of US$0.0000628 in May 2026. Since that break, SHIB has continued to hit lower highs and lower lows. This pattern often suggests that the seller is still in control of the overall trend.
Currently, SHIB prices are trading around US$0.0000415 after several weeks of narrow consolidation. Analysis pointed out that this is similar to the trend from April to June 2023, when the Shiba Inu currency was consolidated sideways, then fell again, and finally hit a partial bottom.
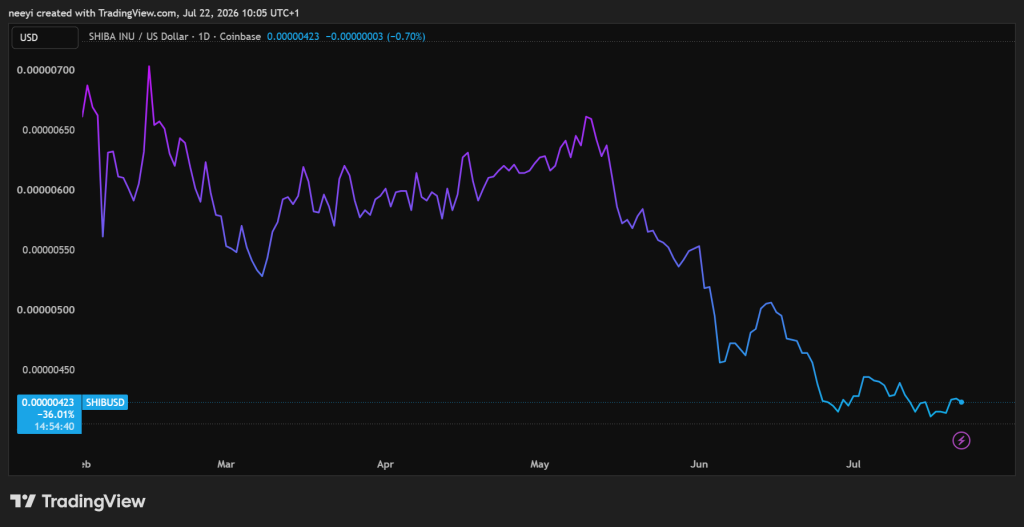 SHIB Price Chart
Based on this historical comparison, the analysis believes that SHIB may fall towards the support area of US$0.000032 to US$0.000033 from late July to August. Based on the current SHIB price close to US$0.0000415, this would mean a decline of about 20%. Although historical patterns do not guarantee future results, they often provide useful reference points when market structures begin to resemble previous cycles.
Shiba Inu coins face multiple challenges in 2026
Broader trends also explain why SHIB has struggled to regain its gains this year. Shiba Inu was valued at a higher level in early 2026, with the SHIB price close to US$0.0001845, and then gradually lost momentum. Recent trading prices have remained between US$0.0000041 and US$0.000043, making the token well below previous levels.
Several factors have contributed to this weakness. A broader correction in the cryptocurrency market has reduced investor interest in risky assets. Macroeconomic uncertainty, including concerns about global tariffs, has also weighed on market sentiment. Competition from the new memin poses another challenge as investors spread their funds across a wider range of projects.
#ShibaInu shows new signs of weakness, and its current price trend is very similar to a bearish pattern that emerged in 2023.$ SHIB has been in a long-term downward trend since losing its key US$0.0000628 support level in May 2026. After that rejection, SHIB has...
These developments have caused Shiba Inu to decline in the cryptocurrency rankings, and SHIB is currently ranked around 33rd by market value. Market expectations for the rest of 2026 remain cautious. A steady sideways consolidation or moderate rally seems more likely than a quick return to previous highs.
On-chain data shows that there are still positive signals below the surface
Despite the weak SHIB price trend, some on-chain indicators continue to paint a more balanced picture. Exchange balances have fallen since mid-July as more SHIBs have been moved into private wallets. Lower exchange balances usually reduce immediate selling pressure because fewer tokens are available for quick sale.
Large households also continued to accumulate during periods of weak prices. One noteworthy transaction involved the withdrawal of approximately 162 billion SHIBs from Coinbase Prime. This move suggests that despite the overall downward trend, large investors remain interested.
Token destruction also continues. A destruction operation in July removed approximately 110 million SHIBs from circulation. Even so, these destruction numbers are relatively small compared to the circulating supply of approximately 589 trillion SHIBs. Many analysts believe that destruction activities need to increase significantly to have a meaningful impact on long-term supply dynamics. Future upgrades through the planned Shib Alpha Layer may eventually automatically achieve more destruction if these features are rolled out as expected.
SHIB daily indicators continue to tilt towards sellers
Daily technical indicators continue to tilt towards bearish, although some readings suggest that downward momentum has begun to stabilize. The Relative Strength Index (RSI) is currently at 42.918 and the signal is sell. This level is still below the neutral 50 mark, indicating that buyers have not regained control of the trend. The Stochastic Oscillator was at 43.168, which also sent a sell signal. Although the indicator is no longer in a deeply oversold area, momentum remains weak.
The MACD indicator currently shows a neutral reading. This suggests that bearish momentum has slowed, but the indicator has not yet confirmed a bullish reversal. The Ultimate Oscillator was 47.438, giving a sell signal again. The reading indicates continued weakness for multiple time periods. The Bull Bear Power indicator remains neutral. In the short term, buyers and sellers are relatively balanced, but neither has established decisive advantages.
The RSI (14) value is 42.918, and the signal is sell, which means that the momentum is still below neutral and the buyer has not regained control of the trend. The value of the Stochastic Oscillator (9,6) was 43.168, signaling a sell, indicating that despite the recent consolidation, short-term momentum remains weak. The MACD (12, 26) value is 0 and the signal is neutral, indicating that bearish pressure has eased, but a bullish cross has not yet occurred. The ultimate oscillator value is 47.438, and the signal is sell, indicating multiple time periods still point to potential weakness. The value of the Bull-Bear Power Indicator (13) is 0 and the signal is neutral, indicating that the strength of the buyer and seller is currently equal.
The latest SHIB price outlook shows a mixed picture. Analysis based on historical comparisons points out that if the current bearish structure continues, SHIB may fall towards $0.000032 again. Daily technical indicators are also leaning towards sellers, although momentum is no longer as weak as at the beginning of the year. Another factor worth noting: exchange outflows, whale accumulation and continued token destruction, which provide some positive signals below the surface, although they have not yet changed the overall trend.
Frequently Asked Questions
Will Shiba Inu coins reach 1 US dollar? It is considered mathematically impossible for Shiba Inu Coin (SHIB) to reach 1 dollar in the foreseeable future.
Will Shiba Inu coins become very big? Shiba Inu Coin (SHIB) is likely to experience a hypsion-driven rebound in the short term, but due to its huge circulation supply, its long-term growth is highly controversial. Analysts have mixed views on its trajectory, with some predicting a moderate rise and others predicting a possible decline. Mathematically, it is impossible for Shiba Inu Coin (SHIB) to reach 1 cent before 2030.






















