
 Exchange Ranking
 Top Exchanges
 24h Volume Ranking
 Popularity Ranking
 Exchange BTC Balance
 Proof of Reserves
 Decentralized Exchanges
 Funding Rate
 Funding Heatmap
 Liquidation Data
 Max Pain
 Long/Short Ratio
 Whale L/S Ratio
 Binance/Okex/Huobi L/S
 Bitfinex Margin L/S
 ETF Tracker
 Solana ETF
 XRP ETF
 Hong Kong ETF
 Bitcoin Treasuries
 Crypto Reversal
 Ethereum Reserves
 HyperLiquid Wallet Analysis
 Hyperliquid Whale Watch
 Large Transactions
 On-chain Movement
 Bitcoin ROI
 Stablecoin Market Cap
 Options Analysis
 News
News Articles
 Economic Calendar
 Features
 Wallet
 Contract Calculator


 Security
 Collections
 Watchlist
 Following
 BTC
BTC  SHIB
SHIB $SHIB is currently trading at around US$0.0000424, an intraday increase of about 0.3%, and has been moving sideways within a fairly narrow range for the past few weeks.
Trading volume is also not active: US$42.884 million in the past 24 hours, which is pretty good for a meme coin, but still not enough to support rapid markets-once it is actually launched, it may not last long.
This is the core of this Shiba Inu price forecast: judging the direction of breakthrough. If buyers enter firmly, there is still good room for upside to the next resistance zone; if sellers continue to gain the upper hand, SHIB is likely to re-test support before other changes occur.
For now, it is just ready to go, waiting for its direction.
$SHIB Today's Price and Market Overview
The price of Shiba Inu Coin is currently close to US$0.00000424, the circulation supply is 589.243 trillion pieces, and the market value is approximately US$2.499 billion. 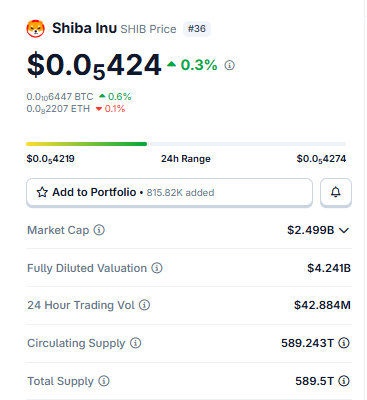 Source: Data from Coingecko, data as of July 23, 2026. Data from other tracking sites may differ slightly.
The fully diluted valuation is significantly higher at US$4.241 billion, a gap that basically reflects the difference between current circulation and the total supply ceiling of 589.5 trillion pieces. This detail is easy to overlook, but if you think carefully about the actual level of Shiba Inu coin's value, it's actually quite important.
The 24-hour trading volume was US$42.884 million. It is worth remembering that with such a huge supply, even if the percentage fluctuates little, there may be considerable actual buying or selling pressure behind it.
$SHIB social sentiment and news
The most important content in today's Shiba Inu news is not the price itself, but the practicality. Purinta, a mortgage platform built based on memecoin, has confirmed that it will soon launch a dedicated $SHIB market.  Source: X account from @TheCryptoBasic.
goes online, holders should be able to use the token as collateral and borrow money from it without actually selling anything.
Judging from feedback from social channels, the market's response to this Shiba Inu news is more rational and pragmatic rather than hypation-driven. What people seem to be really concerned about is the long-term value of the lending market to Shiba Inu holders, rather than seeing it as another reason to chase short-term offers.
Concentration of Shiba Inu holders
If you are a smaller holder, the following data may make you feel uneasy. The top 100 wallets control 83.15% of the total supply.
Looking further, the whale tier-which accounts for only 0.04% of all holders-accounts for 94.48% of the market value. The Gini coefficient is 0.9957, which is almost the most unbalanced of these distributions. 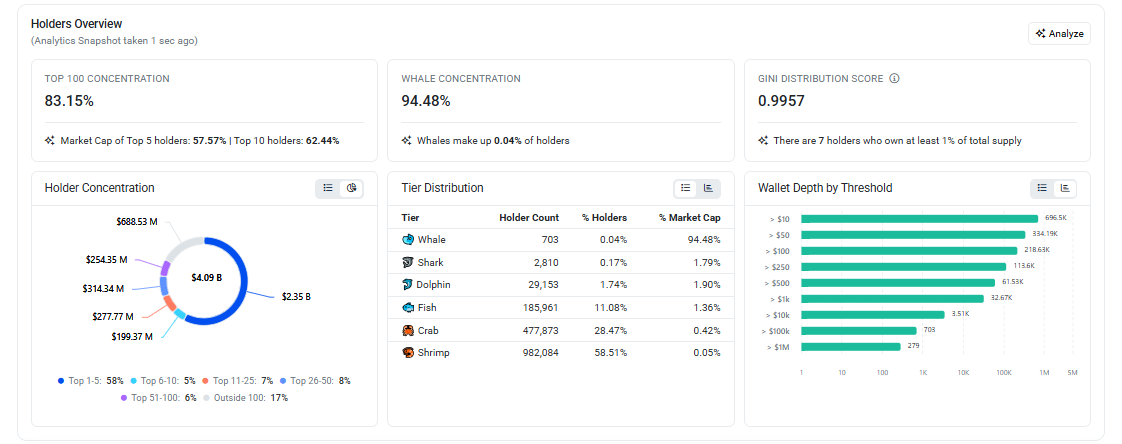 Source: Holder data is taken from Etherscan.
Further broken down, the top 1-5 wallets hold 58% of the total, the 6th-10th wallets account for 5%, the 11th-25th wallets account for 7%, the 26th-50th wallets account for 8%, and the 51st-100th wallets account for 6%. The remaining 17% is divided among all but the top 100 holders.
Wallet depth data illustrates the same problem from another perspective: 696,500 wallets hold more than $10 in $SHIB, but only 279 wallets across the network hold more than $1 million. This gap alone is enough to confirm that Shiba Inu whales are methodically accumulating tokens, and that when a few addresses control such a large supply, their decisions are far more influential than any wave of retail purchases.
These are no reasons for panic. This concentration is common in meme coins, but it is a reasonable risk factor to keep in mind before deciding on the size of your position.
Comparison of SHIB with other major Meme coins
Tokens| 24-hour change| Form
Shiba Inu (SHIB)| +0.3% |Rising channel (4H) + downtrend line test (1D)
Similar to large-scale Meme coin| rose and fell| Volatile in the range near key support levels
Mid-session Meme coins| rose and fell| Consolidating below previous highs
Please regard this comparison as a reference for an industry overview rather than absolute truth. Before making cross-token conclusions, be sure to refer to real-time charts.
4-hour chart of Shiba Inu coins: The rising channel that is about to be squeezed
Switching to the 4-hour chart, SHIB has been steadily climbing in a fairly clear rising channel: higher lows are superimposed on higher lows, and higher highs follow. The current price is close to the upper edge of the channel. 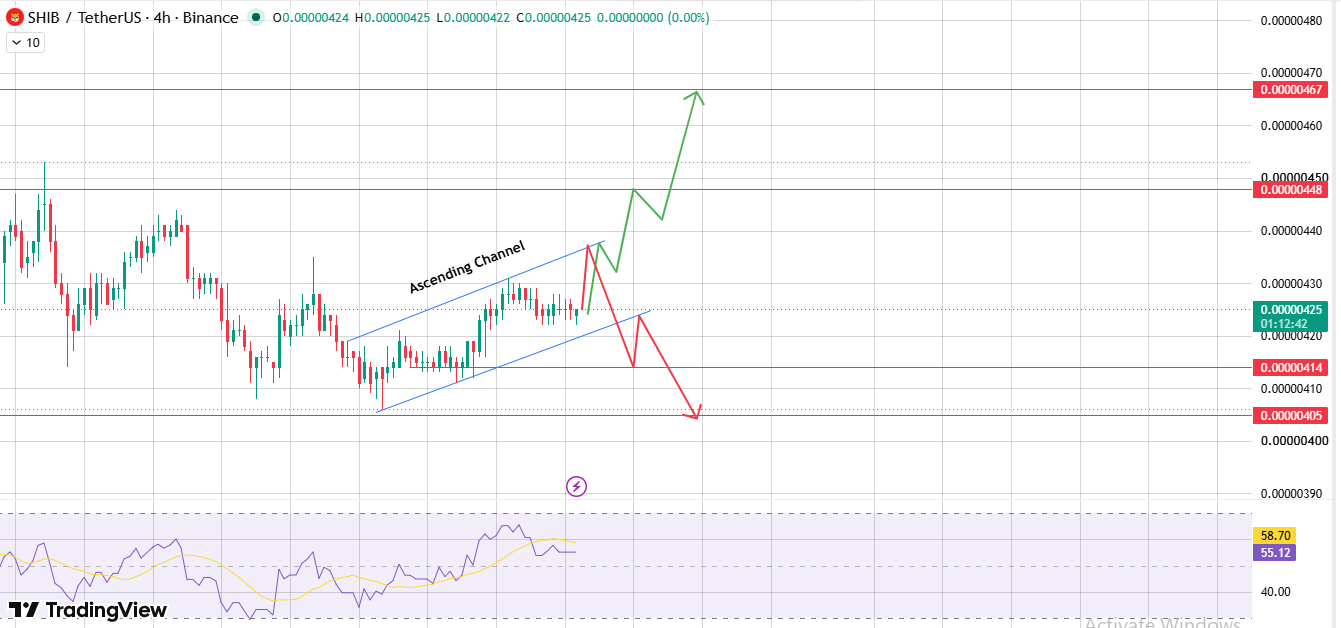 Source: The chart is taken from TradingView, dated 2026-07-23.
After breaking through the upper boundary, the next target range is approximately US$0.0000448 to US$0.0000467. If you fall out of the channel from below, focus on US$0.0000414 first. If this level falls, the lower level will be further supported at US$0.0000405.
The kinetic energy of this time frame has not yet been fully directed and is in a neutral long region-this usually occurs just before the channel determines its direction.
###1-Day Chart of Shiba Inu Coin: The downtrend line acts simultaneously with the Wolf Wave
Pulling back to the daily chart, a different, longer-term structure comes into view: A downtrend line has quietly suppressed prices for weeks, and it just passes through the precise area that SHIB is testing today. 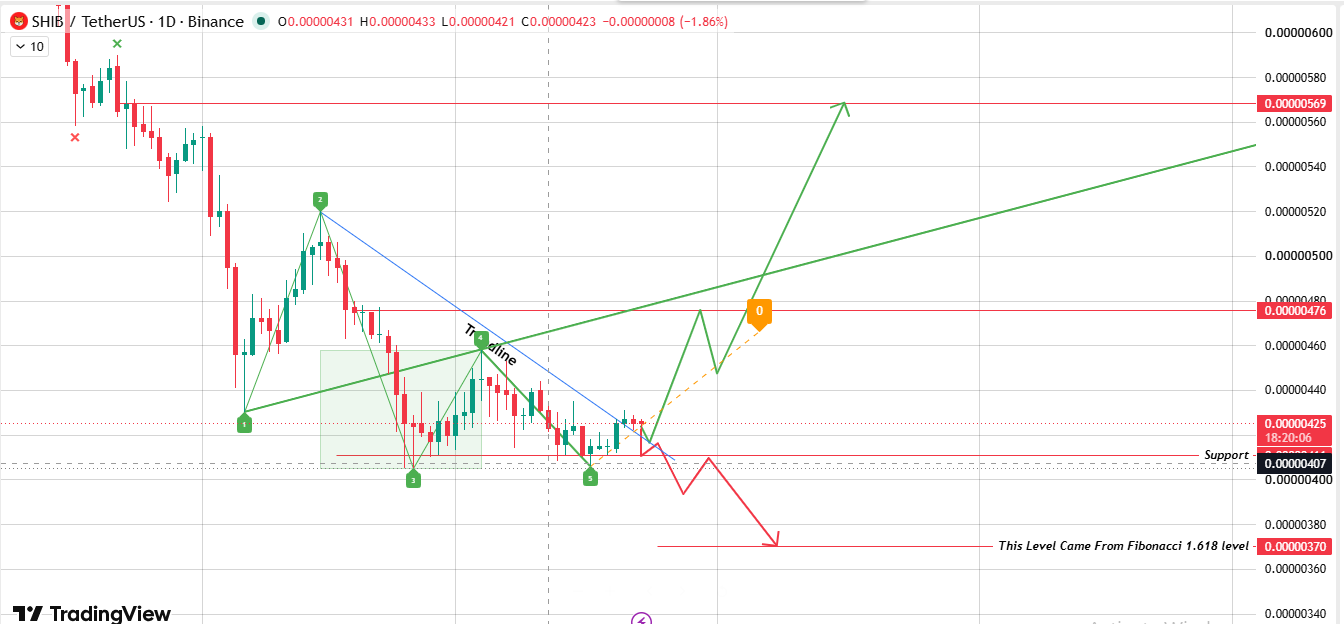 Source: Chart taken from TradingView, dated 2026-07-23.
Above this trend line is a pattern that looks a lot like a Wolf Wave-a five-point structure-that traders use to predict where prices are likely to go after the structure finally breaks through.
If this downtrend line is breached and the price closes above it, the near-term target is around US$0.0000476; if buyers really make efforts, the more optimistic Fibonacci expansion target can reach US$0.00000569.
If the trend line holds its ground and pushes prices down again, then $0.0000407 is the most important support level. Once a loss occurs, the Fibonacci 1.618 extension will point the downside target near $0.0000370.
Shiba Inu Price Forecast: Call, Benchmark and Bear Scenarios
Scenarios| trigger condition| immediate objective| Extended Target
Bullish| The trend line broke upward on the 1st day; the 4H channel was confirmed by heavy volume| $0.0000448| US$0.0000467 → US$0.0000476 → US$0.0000569
Benchmark| Prices remain within the 4H channel| range volatility| Kinetic energy remains neutral until a clear breakthrough or a bearish break below
| The 1st trend line is held as resistance; 4H channel support fails| US$0.0000414 → US$0.0000405| US$0.0000407 → US$0.0000370
Any Shiba Inu price forecast that only boasts a bullish Wolf Wave target and ignores the trend line rejection tells only half the story. Both forms are warning that the real market is coming, but the direction has not yet been determined.
Will Shiba Inu coins rise? Straight view
So, in the final analysis, what is the situation? SHIB is currently at key decision points on both the 4-hour chart and the daily chart, and this overlap is not common.
The uptrend channel of the shorter time frame and the downtrend line of the daily chart are now being tested almost simultaneously. If support at both levels is held, Wolf's Wave's forecast points to more meaningful upside: the near-term target is in the range of $0.0000448 to $0.0000467. If the daily structure breaks in the right direction, the farther target may reach $0.0000476 to $0.0000569.
Like most meme coins with similar market capitalizations, SHIB does not operate completely independently. Changes in Bitcoin's dominance and broader cryptocurrency risk appetite often determine how much upside such tokens can actually gain after a form breakthrough. If BTC prices move steadily, it usually means that the shape of SHIB will evolve in the direction shown in the chart. If BTC fluctuates violently, it usually means that SHIB's channels and trend lines will break through in a faster and more chaotic way than the clean lines on the chart suggest.
There is another question that has never disappeared: Will Shiba Inu coins reach 1 US dollar? To be honest, it doesn't work mathematically. With more than 589 trillion pieces in circulation, a US$1 SHIB would mean a market value larger than all other asset classes on the planet combined. This is not pessimism, this is arithmetic. For this to be theoretically possible, supplies need to be reduced by several orders of magnitude through sustained and aggressive destruction. The increase in the destruction rate of Shiba Inu coins will occasionally boost sentiment for a day or two, but at the current scale, relative to the total supply, the destruction amount is simply not enough to change the situation alone.
A more realistic perspective on the future value of Shiba Inu is the technical picture listed above: small, fractional century-level fluctuations based on actual chart structure, rather than a dollar fantasy based on hope.
Whether the final form of this Shiba Inu cryptocurrency is bullish depends on whether buyers appear and hold both the channel and trend line in the next few trading sessions, rather than on any single Purinta-style headline or isolated Wolf Wave sign. If the history of Shiba Inu coins has taught us anything, it is that truly lasting markets are always accompanied by tangible transaction volume, not just social media noise.
Quick Glossary
Upward channel: A rising price structure framed by parallel support and resistance lines is generally considered bullish as long as prices respect two boundaries.
Wolf Wave Pattern: A five-point structure where traders use the symmetry of previous price fluctuations to predict targets. It focuses more on where these fluctuations suggest prices want to go next than on how the pattern itself looks.
Downtrend line: A downward sloping line connecting a series of lower highs, used to measure whether sellers are still suppressing every rebound attempt.
Fibonacci Extension: The level projected beyond the completed price movement is often used to estimate how far the market is likely to go once a pattern breaks through.
A brief explanation of how this article is written
Each level mentioned here-channel boundaries, trend line areas and Wolf Wave Targets-is taken directly from the 1D and 4H charts reviewed at the time of writing. Nothing is a guess or stretch beyond the scope of the chart itself.
Holder concentration data comes from analytical snapshots rather than real-time data streams; price, market cap and supply numbers reflect snapshots at the time of writing, so some of these numbers may have changed slightly as you read this article. Be sure to check real-time charts before taking action on any of the above.
Disclaimer : This document is for information purposes only and does not constitute financial advice. The cryptocurrency market is highly volatile; please study by yourself before investing.






















