
 Exchange Ranking
 Top Exchanges
 24h Volume Ranking
 Popularity Ranking
 Exchange BTC Balance
 Proof of Reserves
 Decentralized Exchanges
 Funding Rate
 Funding Heatmap
 Liquidation Data
 Max Pain
 Long/Short Ratio
 Whale L/S Ratio
 Binance/Okex/Huobi L/S
 Bitfinex Margin L/S
 ETF Tracker
 Solana ETF
 XRP ETF
 Hong Kong ETF
 Bitcoin Treasuries
 Crypto Reversal
 Ethereum Reserves
 HyperLiquid Wallet Analysis
 Hyperliquid Whale Watch
 Large Transactions
 On-chain Movement
 Bitcoin ROI
 Stablecoin Market Cap
 Options Analysis
 News
News Articles
 Economic Calendar
 Features
 Wallet
 Contract Calculator


 Security
 Collections
 Watchlist
 Following
 BTC
BTC  DOGE
DOGE  ETH
ETH  SHIB
SHIB  UNI
UNI Today's Shiba Inu coin price forecast starts with current data: SHIB fell 1.4% to $0.00004182. This is about 95% down from the all-time high of $0.0008845 set in October 2021, when the meme coin craze pushed Dogecoin to its peak. In every discussion about "meme coins",$SHIB and DOGE are always mentioned-both are in huge supply and are both community-driven. However,$SHIB focuses more on token destruction and its Shibarium ecosystem, while DOGE further builds on the hype wave of the Musk era. The next trend of SHIB depends on a certain pattern formed on the current daily and 4-hour charts, as well as a noteworthy open position concentration data. One by one will be analyzed below.
SHIB Price Snapshot (July 24, 2026)
Indicator: Price
Value: $0.000004182
24-hour change: -1.4%
Market value: $2.464B
Fully diluted valuation: $4.182B
24-hour trading volume: $58.625M
Circulation supply: 589.243T SHIB
Total supply: 589.5T SHIB
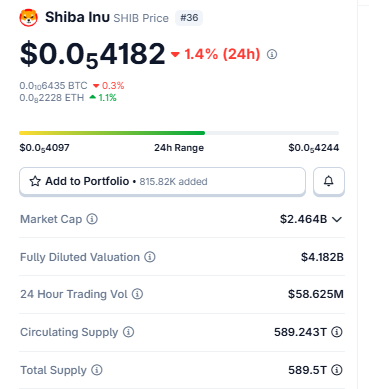
Supply is in trillions, which is why prices have moved slightly-from $0.00004182 to $0.00004444, which may seem small on the screen, but once the orders of magnitude are considered, this represents a real percentage change.
Liquidation data: two-way shocks, not one-way
The dollar amount here is small, but the pattern is worth paying attention to. In the past hour, a total of $197.92 was cleared, all from short positions and zero for long positions. The 4-hour window shows the same situation: total liquidation of $199.59, all short positions, which is consistent with the trend of $SHIB rising slightly sideways and squeezing short positions.
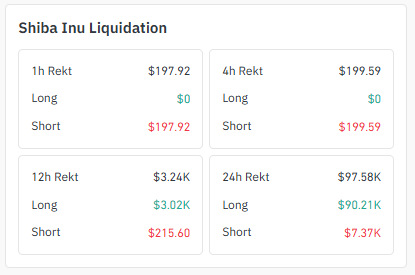
However, lengthening the time to 12 hours, the situation reversed: $3.24K was cleared, of which $3.02K came from long positions and only $215.60 came from short positions, indicating that there had been a more violent volatility before that over-leveraged bulls were caught off guard. During the full 24 hours, the total liquidation amount was $97.58K, of which the bulls were $90.21K and the shorts were $7.37K, so overall, the bulls still suffered more losses, despite the reverse trend in recent hours. This is more like a trading session that hits both long and short sides at different points in time, rather than a unilateral squeeze.
Exchange Trading Volume and Position Concentration
SHIB's exchange trading volume is not concentrated on a single large platform, but is scattered among several medium-sized exchanges. LBank led with $14.65M, OKX followed closely with $10.27M, MEXC with $6.10M, and Bitget, Bitunix and Kraken ranked in order.
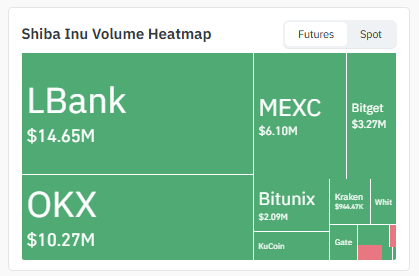
Liquidity is thinner and more dispersed than mainstream currencies such as DOGE or UNI, which usually means more price volatility, depending on which exchange dominates order flow at a particular moment. However, it is the concentration of positions that is the real extreme. The top 100 wallets hold 83.16% of the total supply. Looking further, the concentration of whale positions is as high as 94.47% of the market value-these wallets account for only 0.04% of all holders.
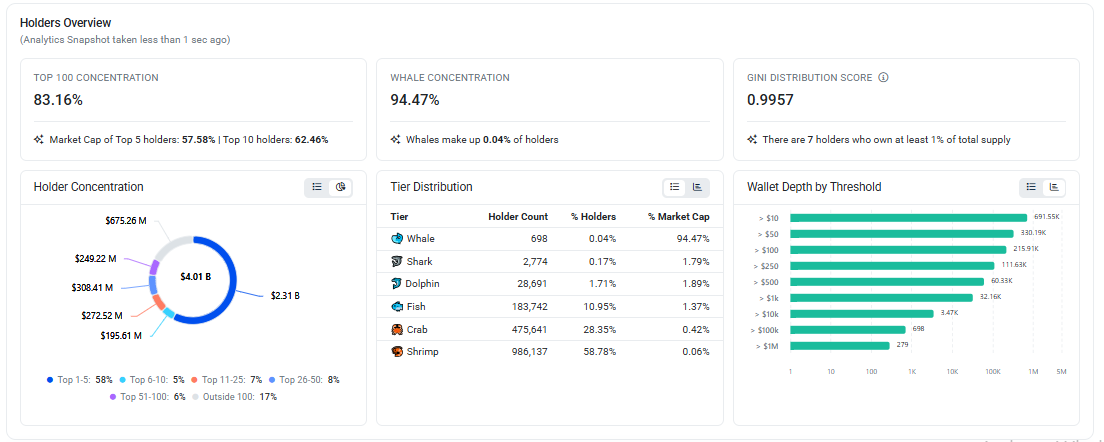
Gini coefficient: 0.9957. Five wallets alone account for 57.58% of the market value, while seven independent addresses each hold at least 1% of the total supply. On the other end, the 986,137 "shrimp" wallets (the largest group in terms of volume) hold only 0.06% of the total. The data itself does not predict direction, but the movement of a few large wallets may change prices faster than any chart pattern.
4-hour chart: Falling channel, on the edge
SHIB's 4-hour candle closed flat at $0.0000419, fluctuating between $0.00000417 and $0.00000420. Prices are clearly within a downward channel, with two boundaries sloping downward in parallel, and current prices are at the intersection of the lower edge of the channel and recent support.
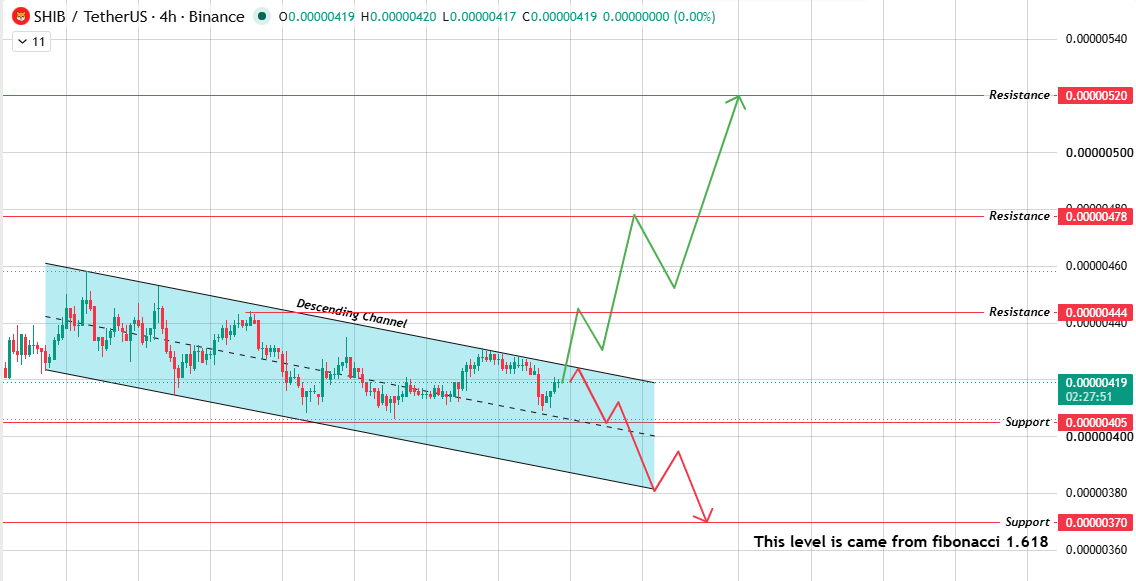
If you break through the upper track, the resistance level will be $0.0000444, then $0.0000478. If momentum continues, look towards $0.0000520. If you break downwards, the support will be at $0.0000405, and the deeper support will be at $0.0000370-this is also the Fibonacci level marked by the daily chart, indicating that the two time frames confirm each other rather than contradict each other.
Daily chart: descending triangle, more Wolf waves
The daily candle closed at $0.00000418, up 0.97%, with a range of $0.0000410 to $0.0000421. The structure here is a descending triangle. Swing points 1 to 5 outline this pattern, with a flat support line below and a downward sloping resistance line above, squeezing the price space.
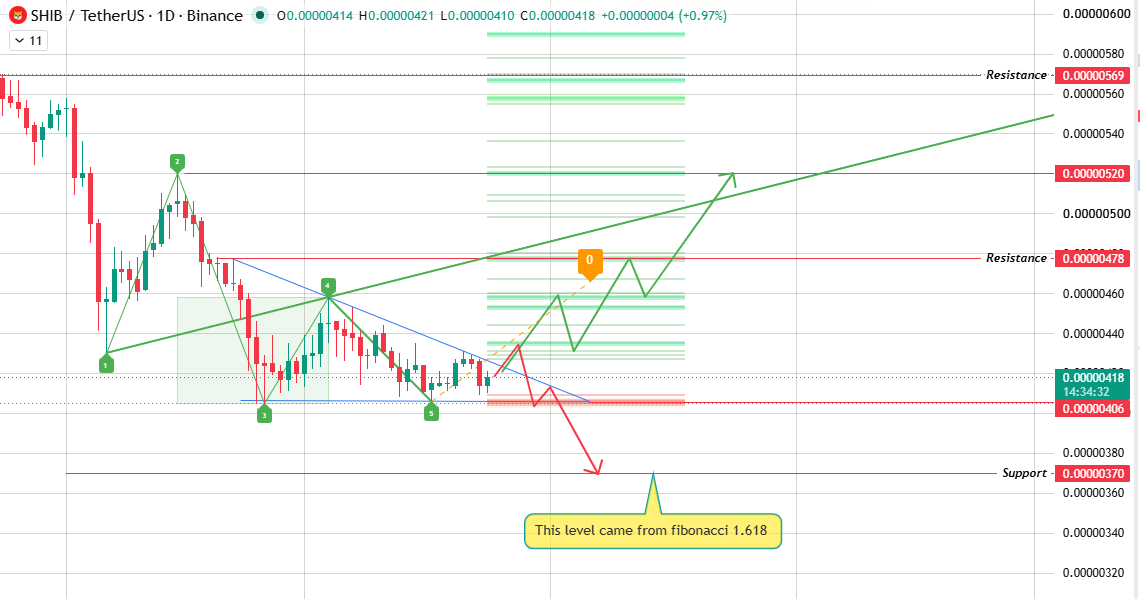
It is worth noting that the Wolf Wave mark on the chart is biased towards bullish, pointing to the upside if the upper boundary of the triangle breaks. Once you break through, look first at $0.0000478. If buyers continue to pour in, look further at $0.0000520 and $0.0000569. A bullish breakthrough is not inevitable, but it is what the Wolf Wave structure currently favors. On the contrary, if the lower boundary falls, the chart points to look at $0.0000406 first and then drop to $0.0000370-this level is directly marked on the chart as the Fibonacci 1.618 extension, which is a clear downward target and requires no speculation.
SHIB Scenario Table
Scenario: Bullish
Trigger conditions: both the channel and rising triangle break upwards, and the Wolf Wave model confirms the bullish trend.
Target area: $0.00000444-$0.0000478 (short-term);$0.0000520-$0.0000569 (extended)
Scenario: Neutral
Trigger condition: Both technical structures remain unchanged, and SHIB maintains sideways consolidation.
Target Area: $0.00000405-$0.0000421
Scenario: Bear
Trigger Condition: Both channels and triangles are invalid, triggering a confirmed bearish break.
Target area: $0.00000405-$0.0000406 (near-term support);$0.0000370 (common Fibonacci bottom)
Correlation between Bitcoin dominance and Ethereum
SHIB runs on Ethereum, so its correlation with Ethereum is more important than is commonly believed. Ethereum's own trends and the Gas fee environment will affect the trading methods of SHIB. In addition, broader changes in Bitcoin's dominance also play a role: $SHIB tends to be left out when funds are heavily diverted to Bitcoin, and re-active when risk appetite spreads to smaller cap altcoins.
Final Outlook
The two time frames tell a consistent story rather than separate words. The daily falling triangle carries a bullish Wolf wave tendency, while the 4-hour falling channel echoes this setting on shorter cycles. If the upper boundaries of both charts are breached, then $0.0000444 to $0.0000478 are realistic short-term goals, and $0.0000520-$0.0000569 are more distant goals. If support falls, then $0.0000370 is the level agreed upon by both charts-this is not a guess, but is embedded in the chart structure itself through a Fibonacci extension. Position concentration is a variable hanging above: less than 0.5% of holders control more than 90% of the market value, and any substantial change in a few of these wallets may overwhelm the triangle and the channel itself.
Glossary
Falling triangle: The flat support line below and the downward sloping resistance line above squeeze prices into a narrower range until one side breaks through.
Downward channel: Two parallel downwardly sloping lines between which prices fluctuate until they break through either boundary.
Wolf Wave: A five-point structure based on a previous swing pattern that traders use to predict the likely direction of prices.
Methodology
Each level here-triangular boundaries, channel edges, support and resistance-is taken directly from the 1-day and 4-hour charts of the SHIB/USDT on July 24, 2026. Clearing data and transaction volume data correspond to it. Position data reflects on-chain snapshots at the same time. The content of this article does not exceed the scope of the actual display of the source chart and data. This document does not constitute financial advice. SHIB is highly volatile and these levels can change rapidly.






















