
 Exchange Ranking
 Top Exchanges
 24h Volume Ranking
 Popularity Ranking
 Exchange BTC Balance
 Proof of Reserves
 Decentralized Exchanges
 Funding Rate
 Funding Heatmap
 Liquidation Data
 Max Pain
 Long/Short Ratio
 Whale L/S Ratio
 Binance/Okex/Huobi L/S
 Bitfinex Margin L/S
 ETF Tracker
 Solana ETF
 XRP ETF
 Hong Kong ETF
 Bitcoin Treasuries
 Crypto Reversal
 Ethereum Reserves
 HyperLiquid Wallet Analysis
 Hyperliquid Whale Watch
 Large Transactions
 On-chain Movement
 Bitcoin ROI
 Stablecoin Market Cap
 Options Analysis
 News
News Articles
 Economic Calendar
 Features
 Wallet
 Contract Calculator


 Security
 Collections
 Watchlist
 Following
 SHIB
SHIB Shibarium's daily trading volume rebounded strongly, but SHIB prices did not follow this trend. This disconnect raises an important question: What currently controls the market value of Shiba Inu coins?
Internet usage can support the value of cryptocurrencies in the long run, but growth in transaction volume itself does not always immediately create demand for their native tokens. SHIB now faces broader market pressures, weak technical aspects and resistance levels that could limit any short-term rebound.
Shibarium reportedly processed 1,180 daily transactions during the most recent statistical cycle. This is a 78.51% increase from the 661 transactions completed on July 21. July 21 was Shibarium's second-lowest day for daily trading volume during July, so the latest growth marks a clear recovery from one of the weakest periods of the month.
SHIB did not benefit from this higher activity. The broader cryptocurrency sell-off pushed Shiba Inu prices from an intraday high of US$0.00004243 to a low of US$0.00004102. The token later recovered some of its losses and traded at close to $0.00004189. Despite the rebound, SHIB fell 1.28% in 24 hours, 8.21% in seven days, and 0.34% in July.
This difference between Shibarium activity and SHIB prices comes down to size and market conditions. The increase of 519 transactions may seem impressive in percentage terms, but the daily volume of 1,180 transactions may still be too small to generate meaningful actual demand for SHIB. Broader market pressures have also outweighed the benefits of network improvements. Major cryptocurrencies have all fallen in recent sell-offs, leaving Shiba Inu still vulnerable despite better Shibarium data.
Shiba Inu prices are still trapped within a narrow trading range
Independent market data shows the SHIB is close to US$0.0000422, although there may be slight differences between different data providers. Judging from the two price readings, the overall situation remains basically unchanged. In the past month, the trading price of Shiba Inu coins has mostly ranged from US$0.0000415 to US$0.0000441. This narrow range suggests that neither long nor short positions have been able to gain firm control.
The latest performance data shows a mixed picture. During the statistical cycle, SHIB rose by approximately 1.13% in 24 hours and approximately 1.67% in 7 days. However, the price of Shiba Inu still fell by about 4.5% in 30 days and 68.38% in one year. The trading price of SHIB also fell approximately 95.23% from its all-time high. Its market value is close to US$2.49 billion, and daily trading volume remains around US$50.78 million.
These figures show that Shiba Inu still maintains considerable market liquidity. However, current trading volumes do not reveal the type of demand typically associated with large SHIB price breakthroughs.
SHIB indicator shows weak momentum despite early signs of recovery
Looking at the SHIB chart, you can see that the momentum is neutral to slightly bearish. Several indicators have improved, but none provides strong evidence that a lasting recovery has begun. The 7th Relative Strength Index (RSI) was 44.92, the 14th reading was 41.64, and the 21st reading was 39.64. RSI values between 40 and 50 usually point to neutral or mildly bearish conditions. The SHIB is still above the oversold level of 30, but well below the overbought level of 70. The higher 7-day RSI shows an improvement in recent performance compared to the longer 21-day cycle, but the improvement is still too limited to confirm a decisive reversal of the trend.
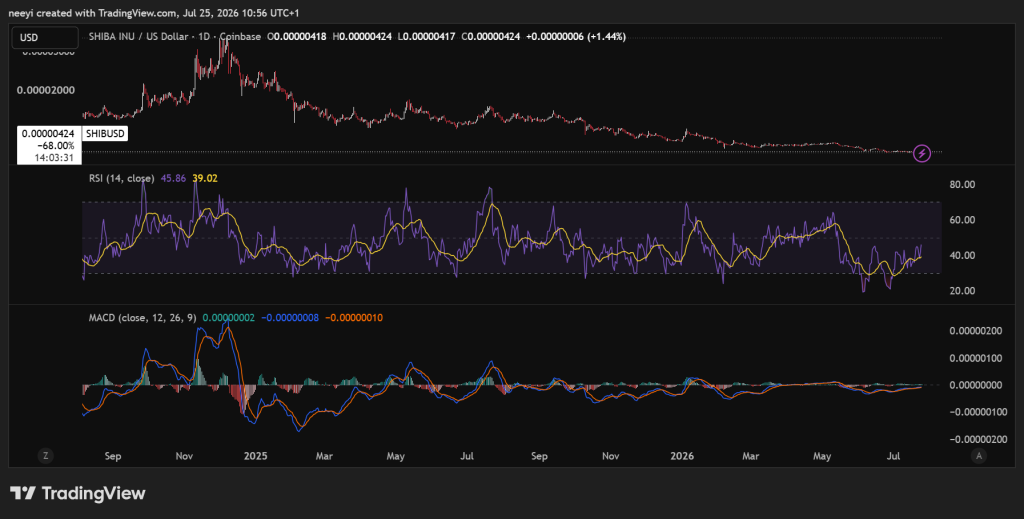
Moving averages convey similar information. The 7th simple moving average is close to US$0.000041,943, the 30th average is close to US$0.000042548, and the 200th average is much higher at US$0.0000058789. SHIB was trading slightly above the 7-day moving average, but below the 30-day moving average. More importantly, the huge gap from the 200-day moving average confirms that the broader bearish trend remains unchanged. The MACD line is minus 0.00000088442, the signal line is minus 0.0000010812, and the bar chart is still plus 0.00000019679. This combination suggests that bearish pressure has eased, but due to the extremely small numbers, recovery signals remain weak and may change quickly. SHIB also traded slightly above the daily pivot point near US$0.00004159. This position gives buyers a slight short-term advantage, but such a narrow distance provides little protection when the market falls again.
SHIB prices are likely to remain between US$0.00000407 and US$0.0000456
The current indicator mix forms three main SHIB price scenarios. Each outcome is highly dependent on broader cryptocurrency market conditions and whether Shibarium's activity translates into stronger demand for tokens.
Basic scenario: SHIB remains within the current range
Relatively stable market conditions may keep SHIB between support levels of US$0.00000407 and US$0.00000417 and resistance levels of US$0.0000444 and US$0.00000456. The area below contains recent swing lows and important Fibonacci levels. The area above covers nearby Fibonacci resistance and recent swing highs. Under this scenario, the RSI reading could remain between 40 and 50 and the MACD could be close to zero as the long and short sides continue to compete within the same narrow price range. The recent increase in Shibarium trading volume may help improve sentiment around the ecosystem, but activity needs to remain high to provide stronger support for Shiba Inu prices.
Bullish scenario: May push SHIB to US$0.0000487
Improving demand for meme or greater progress at Shibarium could help SHIB challenge its recent highs near $0.0000456. After confirming a breakthrough in this resistance level, a target level between $0.0000470 and $0.0000487 may be opened. This result requires the SHIB to remain above the daily pivot point and the 7-day moving average, the RSI reading may need to rise to the 55 to 65 range, and the MACD histogram needs to become more positive. Only when trading volume continues to grow over multiple trading days can the network recovery be more convincing. A strong daily reading alone does not confirm that Shibarium use has entered a period of sustained expansion.
Bear scenario: May follow a break below US$0.0000407
Another weakening of the cryptocurrency market may push SHIB lower to near the recent support level of US$0.00000407. Continuing to fall below this level will end the current range and put Shiba Inu coin facing a new local low. Under this result, the RSI reading could drop to 35 or lower, and MACD is likely to return to a more clearly negative position as selling pressure increases. A rapid recovery above the daily pivot line will weaken the bearish scenario. SHIB then needs to re-enter the $0.0000417 to $0.0000444 zone to recover its previous range.
Shibarium's 78.51% increase in trading volume is indeed encouraging compared to the weak July 21 data. However, SHIB prices remain subject to broader market pressures and difficult technical structures. Internet activity must remain strong over a longer period of time to support more convincing changes in demand. The SHIB also needs to regain nearby resistance and move closer to its 30-day moving average for the chart to provide a clearer signal of recovery. Shiba Inu is currently facing an important test between US$0.0000407 and US$0.0000456. The next move beyond that range will reveal whether Shibarium's recovery in trading volume has real staying power or is just a brief improvement in a difficult month.
FAQs
Can Shiba Inu coins reach 1 US dollar?
It is highly unlikely that Shiba Inu will reach 1 US dollar because it would require an unrealistic market value of approximately US$589 trillion, which exceeds the total value of all assets in the world.
Where will SHIB be in five years?
Five years later, the position of Shiba Inu will depend on ecosystem development, market volatility and token practicality, with forecasts ranging from moderate increases to significant declines.






















