
 Exchange Ranking
 Top Exchanges
 24h Volume Ranking
 Popularity Ranking
 Exchange BTC Balance
 Proof of Reserves
 Decentralized Exchanges
 Funding Rate
 Funding Heatmap
 Liquidation Data
 Max Pain
 Long/Short Ratio
 Whale L/S Ratio
 Binance/Okex/Huobi L/S
 Bitfinex Margin L/S
 ETF Tracker
 Solana ETF
 XRP ETF
 Hong Kong ETF
 Bitcoin Treasuries
 Crypto Reversal
 Ethereum Reserves
 HyperLiquid Wallet Analysis
 Hyperliquid Whale Watch
 Large Transactions
 On-chain Movement
 Bitcoin ROI
 Stablecoin Market Cap
 Options Analysis
 News
News Articles
 Economic Calendar
 Features
 Wallet
 Contract Calculator


 Security
 Collections
 Watchlist
 Following
 BTC
BTC  DOGE
DOGE  XRP
XRP Bitcoin, Ripple and Dogcoin Price Forecast (July 25)
Bitcoin, Ripple and Dogcoin again faced selling pressure on July 25 after buyers failed to hold on to several short-term price levels. Bitcoin began to fall on Friday morning, and then Ripple and Doggecoin also weakened.
Technical indicators are currently bearish on all three assets, although nearby support levels could still trigger a temporary rebound. Bitcoin faces a critical test around US$63,700. Ripple must hold on to its current support area, while Dogecoin remains trapped within a narrow price range.
Bitcoin price forecast: US$63,700 may determine today's direction
Bitcoin began to fall from a peak of around US$65,760 early Friday. Subsequently, the price of Bitcoin fell to about $63,900, just below the important $64,200 level. Current market data shows that Bitcoin is located around US$63,932, with an intraday decline of approximately 2.25%. Bitcoin hit a high of about US$65,717 on the day and then fell to an intraday low of about US$63,703.
This decline puts Bitcoin close to support near $63,700. If it can successfully hold this level, Bitcoin may rebound to $64,200. If both sides do not gain enough control, Bitcoin may fluctuate between these two levels. If Bitcoin falls below $63,700, bearish pressure will be even more worrying. This trend could open the way for the day to fall towards $62,700. If $64,200 is recovered, the short-term outlook will improve, and Bitcoin may then target $64,760 and then move towards $65,500.
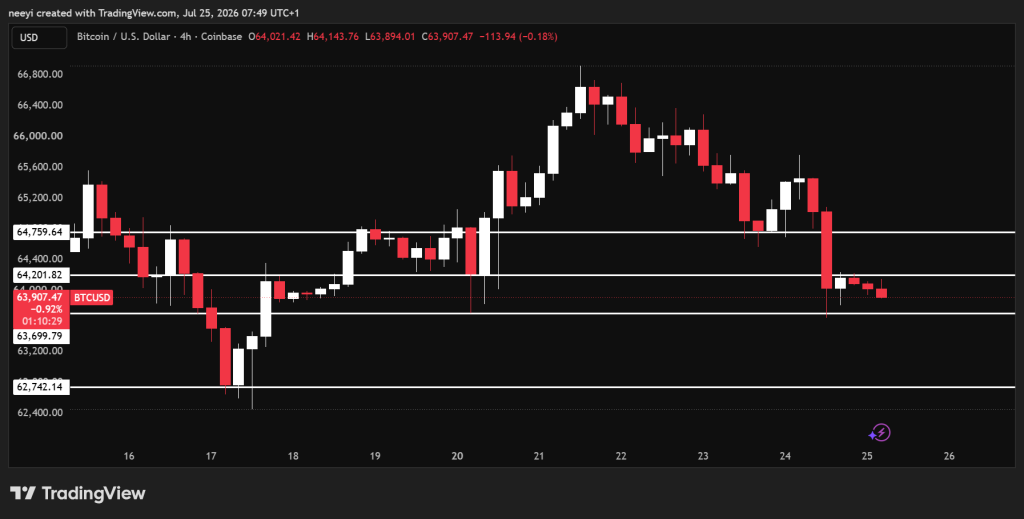
Bitcoin's forecast today depends on the US$63,700 support level
Bitcoin's technical indicators are currently biased towards sellers. Each indicator measures a different part of Bitcoin's price structure, although all four indicators currently give the same reading.
The Relative Strength Index (RSI) is 37.552. This figure suggests that selling pressure remains strong, although Bitcoin has not yet reached the traditional oversold reading of below 30. The moving average convergence and divergence indicator (MACD) read minus 197.6. A negative MACD value means that short-term price strength remains weaker than long-term market trends. The final oscillator reading is 40.359. This indicator combines multiple cycles to measure market pressure. Readings below 50 support the bearish outlook as buying intensity remains limited. The long and short power indicator is minus 1,410.066. Deep negative values indicate that sellers now have greater control over the short-term price direction of Bitcoin.
Indicator values: RSI(14) 37.552 (sell), MACD(12,26) minus 197.6 (sell), Ultimate Oscillator 40.359 (sell), Long Short Force (13) minus 1,410.066 (sell). Indicator summary: 4 sell signals-sell. The indicator summary is still bearish, but the price reaction around $63,700 deserves close attention. A rebound could bring Bitcoin back to $64,200, while a confirmed break could expose $62,700.
Ripple Price Forecast: Facing Important Support Test again
Ripple has fallen for three consecutive days. If the decline closes again on July 25, the bearish series will be extended to four days. At the beginning of the analysis, the Ripple price was near the support level of around US$1.081. A break below this zone could push Ripple towards $1.063 for the day. Current market data shows that Ripple is close to US$1.059, which means the token has tested a low bearish target. This development makes price responses around $1.063 particularly important.
If US$1.081 can be recovered, Ripple may return to the previous consolidation range of US$1.081 to US$1.10. Buyers need to regain $1.10 before the short-term outlook will be more optimistic. After confirming a breakthrough of US$1.10, the price of Ripple may rise to US$1.12. If it fails to recover US$1.063, Ripple may face further selling pressure.
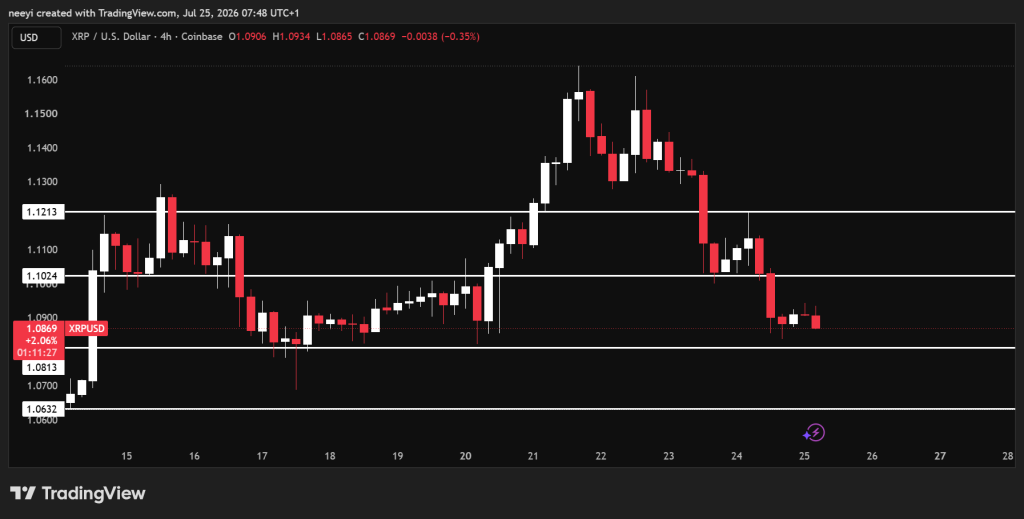
Today's forecast for Ripple: Still bearish below US$1.10
The RSI of Ripple is 37.934. The reading confirmed weak demand, although the token remained above the traditional oversold boundary of 30. The MACD reading is minus 0.006. This small negative value means that Ripple still lacks enough strength to reverse its recent decline. The final oscillator reading of 34.092 shows sellers still dominate over the multiple cycles measured by the indicator. The long-short power indicator was minus 0.0288, further supporting the bearish outlook for Ripple as sellers continue to control the current structure.
Indicator values: RSI(14) 37.934 (sell), MACD(12,26) minus 0.006 (sell), Ultimate Oscillator 34.092 (sell), Long Short Power (13) minus 0.0288 (sell). Indicator summary: 4 sell signals-sell. All four Ripple indicators are biased towards sellers. Ripple needs to recover $1.081 to challenge $1.10 and relieve current bearish pressure.
Dogecoin Price Forecast: DOGE is still trapped in a narrow range
Since Thursday afternoon, Dogecoin's trading range has been approximately between US$0.0684 and US$0.070. During this period, neither long nor short parties established clear control over the price of dogcoin. Current market data shows that dogcoin is close to US$0.0692. DOGE hit a high of approximately US$0.070 during the day and a low of approximately US$0.0683.
A breakthrough of $0.070 may push DOGE prices to $0.0715. Buyers need stronger volume to maintain the rebound above the first target. A break below $0.0684 will weaken the current structure, and Dogecoin could then fall to $0.068 before testing support again.
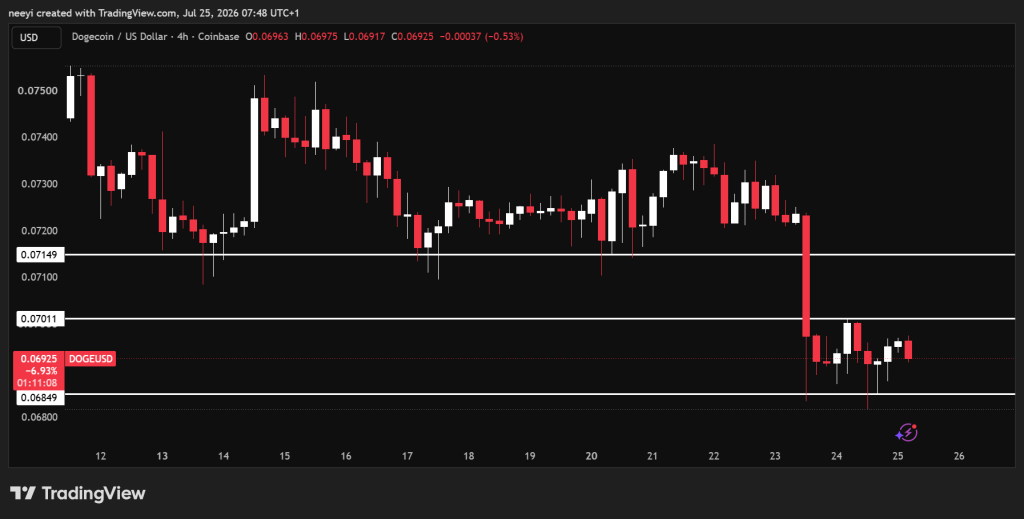
Today's forecast for dogcoin: it needs to break through the US$0.0684 to 0.070 range
The RSI of Dogecoin is 34.859. This value is close to oversold territory, but it still sends a sell signal as buying intensity remains weak. The MACD is minus 0.001, confirming that DOGE has limited upside power under current market conditions. The Ultimate Oscillator was the only indicator that gave a positive reading of 54.469. Values above 50 indicate that there is still some buying pressure over the multiple cycles measured. The long-short power indicator read minus 0.0009, and despite the positive final oscillator, the seller still has a slight advantage.
Indicator values: RSI(14) 34.859 (sell), MACD(12,26) minus 0.001 (sell), Ultimate Oscillator 54.469 (buy), Long Short Force (13) minus 0.0009 (sell). Indicator summary: 3 sell signals, 1 buy signal-sell.
FAQs
Does dogcoin have a future?
The future of Dogecoin is full of uncertainty, driven by community popularity, but lacks the profound practicality of other networks. It is worth around $0.069 and relies heavily on social media attention, low transaction fees for micro-rewards, and speculative trading.
Will Ripple hit US$10?
Yes, it is theoretically possible for Ripple to reach US$10, but it is extremely challenging because it requires its market value to exceed US$600 billion. Analysts generally believe this is a long-term, extremely optimistic scenario rather than a near-term possibility.
What is the use of Bitcoin (BTC)?
You can use Bitcoin as a payment method for goods or services. More and more retailers are currently accepting Bitcoin, and its commercial use is also expanding. Bitcoin can also be used as a currency for international remittances or as an investment.






















