
 Exchange Ranking
 Top Exchanges
 24h Volume Ranking
 Popularity Ranking
 Exchange BTC Balance
 Proof of Reserves
 Decentralized Exchanges
 Funding Rate
 Funding Heatmap
 Liquidation Data
 Max Pain
 Long/Short Ratio
 Whale L/S Ratio
 Binance/Okex/Huobi L/S
 Bitfinex Margin L/S
 ETF Tracker
 Solana ETF
 XRP ETF
 Hong Kong ETF
 Bitcoin Treasuries
 Crypto Reversal
 Ethereum Reserves
 HyperLiquid Wallet Analysis
 Hyperliquid Whale Watch
 Large Transactions
 On-chain Movement
 Bitcoin ROI
 Stablecoin Market Cap
 Options Analysis
 News
News Articles
 Economic Calendar
 Features
 Wallet
 Contract Calculator


 Security
 Collections
 Watchlist
 Following
 BONK
BONK  BTC
BTC  DOGE
DOGE  PEPE
PEPE  SHIB
SHIB ,
, and tags for structured presentation. It is suitable for directly embedding into web pages or content management systems. Shiba Inu Price Forecast: The key depends on this.
Shiba Inu Price Forecast: The key depends on this.
To be honest, this Shiba Inu Price Forecast comes down to only one question: Can buyers finally push $SHIB out of its narrow range that has been lingering for several days? Prices are still well below the highs hit earlier this year, and they are not alone. DOGE and PEPE also experienced similar degrees of cooling. In contrast,BONK has had much larger single-day fluctuations in recent days, so $SHIB actually appears unusually calm, with prices moving slowly in the form of small ups and downs rather than sharp spikes. If buyers intervene with actual transaction volume, the upper edge of the range is within reach. If this fails, prices can be expected to re-test the level of support that SHIB has not seen in weeks.
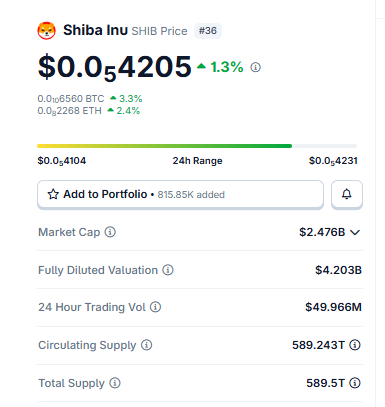
SHIB Price Snapshot
Indicators: Current price: $0.000004202;24-hour change: -1.28%; 7-day change: -8.21%; Market value: $2.476B; Fully diluted valuation: $4.203B;24-hour trading volume: $49.966M; Circulation supply: 589.243T SHIB; Total supply: 589.5T SHIB。
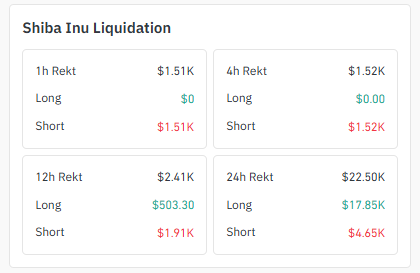
SHIB Liquidation Heat Chart: Short squeeze dominates short-term trend
According to Coinglass's liquidation data, the situation is slightly divided. In the past hour, about US$1.51K short positions were cleared, while bulls were barely affected; the four-hour window showed almost the same situation at around US$1.52K. Basically, this is a small and sharp upward squeeze. However, if the time was extended to a full day, the situation reversed. The total 24-hour liquidation amount was US$22.50K, but this time the bulls suffered a bigger hit, reaching US$17.85K, while the short positions were only US$4.65K. As a result, traders betting on a rally have been hit more frequently in the past day, despite recent hours favoring short squeezing. When a coin is trapped in a range like this, this kind of back-and-forth tug is quite typical.
$SHIB Exchange Volume Thermo Chart
Most trading activity is concentrated on a few exchanges. LBank currently leads the lead with futures trading volume of $11.1 million, followed by OKX with $8.4 million, before volume dwindled to MEXC ($4.07 million), Bitget ($3.35 million) and Bitunix ($2.05 million). In contrast, Kraken and KuCoin's trading volume is almost negligible.
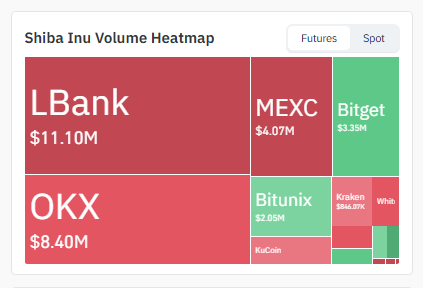
This concentration of trading volume in derivatives rather than in cash is a fairly obvious implication: leveraged traders, not long-term buyers, currently dominate short-term price movements.
Position concentration and Shiba Inu whale activity
To be honest, the holder data is quite unbalanced. The top 100 addresses alone hold 83.17% of all SHIBs in circulation, while whale wallets (only 0.04% of total holders) hold 94.48% of market value. The Gini coefficient reaches 0.9957, almost the most extreme tilt, and there are seven independent wallets each holding at least 1% of total supply.
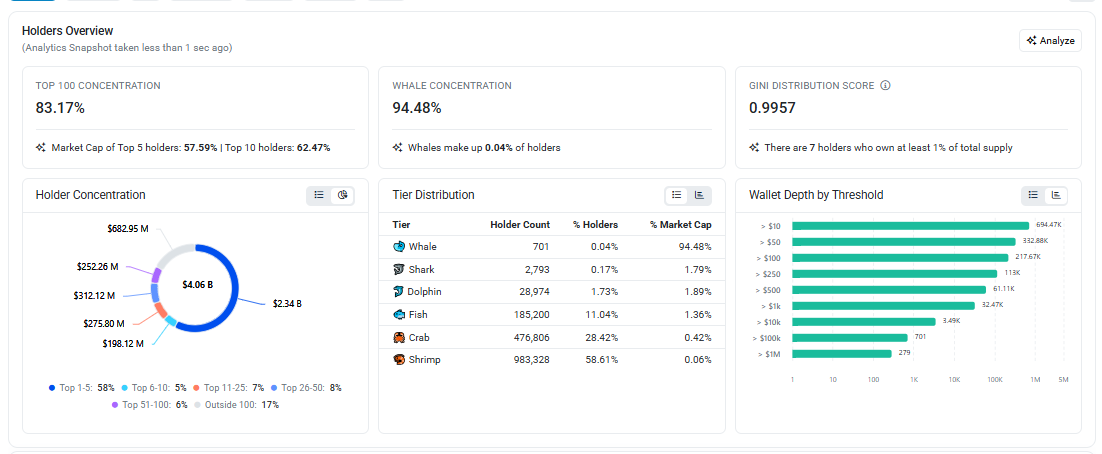
In contrast, holders of the "shrimp" level: 983,328 small holders only shared 0.06% of the supply in total. Faced with such numbers, position concentration is more than just an annotation; it is a real factor in the possibility of price changes in a short period of time. It is worth paying close attention to Shiba Inu whale activity. If these capital flows start to turn bullish, that is, tokens flow out of the exchange into cold wallets, it will be a truly bullish signal to be vigilant about.
Shiba Inu News: Shibarium activity climbs
Most recent Shiba Inu news actually focuses on Shibarium, not the token itself. The daily transaction volume of the second-tier chain jumped to 1,180 transactions, compared with 661 transactions on July 21, an increase of 78.51% in just a few days.
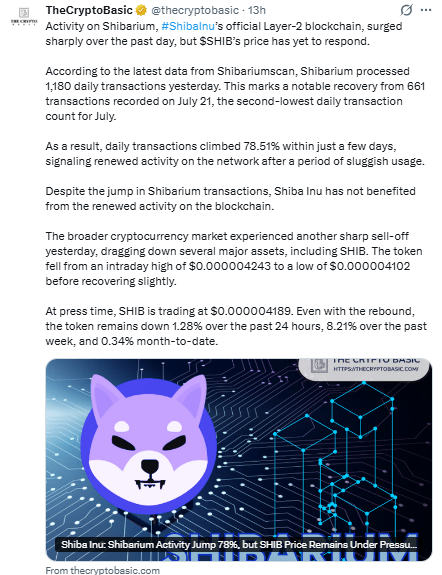
There is no doubt that this is indeed a milestone in the Shibarium blockchain of Shiba Inu. However, prices have not fluctuated too much as a result, indicating that the market may want to see this activity persist for longer before it begins to include it in pricing.
SHIB 4-hour chart: Higher and low point structures remain intact
Zoom in to the 4-hour chart, the situation is a little optimistic. SHIB has gradually formed higher lows within an upward channel, and the structure has survived the recent correction and has not been broken.
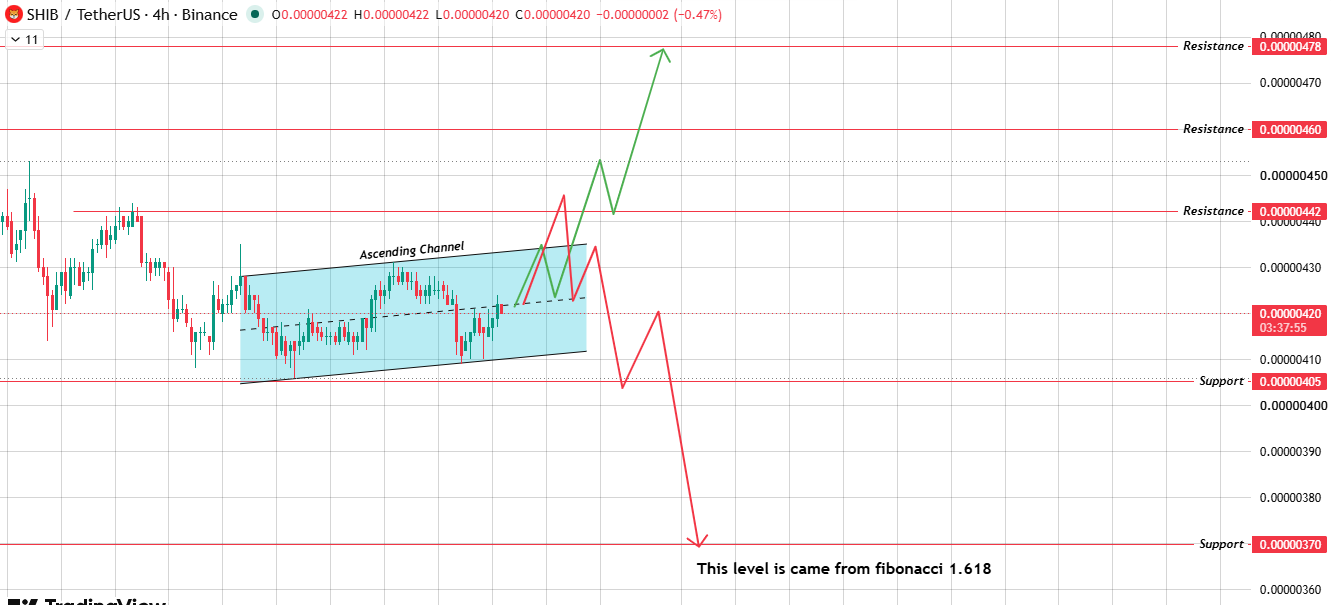
As long as this trend line support continues to catch every decline, the short-term bias remains moderately bullish. Once $0.0000442 is exceeded, the upward trend will be confirmed, and the next target is $0.0000460, followed by $0.0000478. But if the rising channel is broken and $0.00000405 also falls, then the structure will transform into a falling channel, prices will fall with lower lows and lower highs, and sellers may try to attack the same area of $0.0000370 on the daily chart again.
$SHIB1 Daily Chart: Range fluctuates, waiting to trigger
stretches to the daily chart, and the SHIB is basically framed within a range, located between the support area of approximately $0.00000405 and the resistance level of $0.0000446. It has been oscillating back and forth in the box for some time, which usually means that traders are waiting for some signal before making a direction choice.
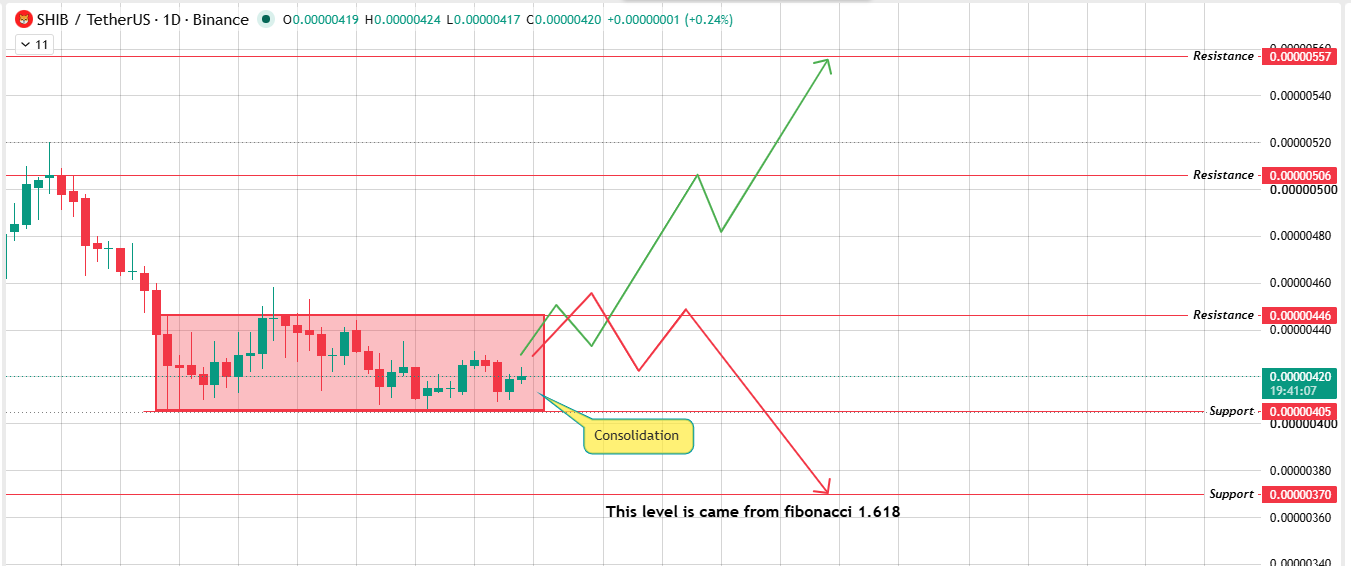
If the daily closing price stands above $0.0000446, buyers will have the initiative and the upper target positions of $0.0000506 and $0.0000557 will be opened. Conversely, if $0.00000405 is lost, the next actual floor price will be $0.0000370, which comes directly from the Fibonacci extension rather than integer guess.
Bullish, Neutral and Bear Scenarios
Scenario: Bullish; Trigger condition: Daily closing price above $0.0000446; Target: $0.0000506 → $0.0000557; Expiration condition: Below $0.00000405.
Scenario: Neutral; Trigger condition: Price remains within the range of $0.0000405-$0.0000446; Target: Shock consolidation within the range; Failure condition: Break through either boundary.
Scenario: Bear; Trigger condition: Daily closing price is below $0.0000405; Target: $0.0000370; Expiration condition: Stand back at $0.0000442.
Probability explanation: Think of these scenarios as chart-based frameworks rather than commitments to future trends. Tokens with huge supplies like SHIB can still fluctuate violently due to a sudden surge in trading volume, macro headlines, or whale decisions to sell.
Bitcoin dominance and broader market relevance
Like most meme coins,$SHIB rarely fluctuates purely based on its own value. It tends to be more inclined to follow Bitcoin's movements than to be influenced by its own news. When Bitcoin's dominance rises, funds usually flow out of small tokens like SHIB; when the trend reverses and the altcoin reaches its peak moment, SHIB is usually one of the larger beneficiaries. Therefore, combining the trend of Bitcoin with the above key levels can make a clearer judgment of whether the breakthrough market is sustainable.
Core Points
The SHIB trading price is close to $0.0000420, remaining within a narrow range where prices have been limited for several trading days.
A daily close above $0.0000446 opens the door to $0.0000506 or even $0.0000557.
Falling below the $0.0000405 support level risks slipping into the $0.0000370 area.
Shibarium's daily trading volume has jumped 78.51% since July 21, but prices have yet to respond.
Whale wallets control 94.48% of the supply, although they account for only 0.04% of all holders.
Is it possible for Shiba Inu to rise to 1 US dollar in reality?
People keep asking about Shiba Inu's potential to reach 1 dollar, so let's just do the calculations. The circulating supply is approximately 589.243 trillion SHIB, which means that the price of 1 dollar will bring its market value close to 589 trillion U.S. dollars. Not only is this impossible, it is several times larger than the entire global economy. Bitcoin, as the largest asset in cryptocurrencies, still has a market value of trillions of dollars, not hundreds of trillions. For Shiba Inu, a more realistic long-term path is to combine steady token destruction with growing demand, rather than a sudden leap to one dollar.
Expert opinion
Frankly, the current shape is more like a spring ready to go than a structure with a clear bias. Both the higher-low structure of the daily range and the 4-hour chart remain maintained and there has been no clear breakthrough to either side. Shibarium's growth in trading volume has yet to drive prices, while whale concentration remains extreme. Based on all these factors, it is more reasonable to wait for which of these key levels to be actually broken through than to guess which side will win first.
Final Outlook: Will Shiba Inu coins rise?
So, will Shiba Inu coins rise from here? To be honest, it depends on which interval boundary will be breached first, and this is currently a completely coin toss probability. If you break through and stand firm above $0.0000446, the momentum will clearly turn bullish. Conversely, if $0.00000405 is lost,$0.0000370 will become the next target. Please regard this Shiba Inu price forecast as a framework that can be responded to, rather than a forecast worth risking all your money. For anyone who buys a SHIB, whether through Robinhood's Shiba Inu trading or otherwise, it is usually wiser to wait for one of these key levels to be actually exceeded than to chase the gains and kill the losses within the range.
Glossary
Support area: The price area where buying forces have historically intervened to slow or reverse declines.
Resistance level: Historically, selling forces have suppressed rising price areas here.
Trend line support: A straight rising or falling line connecting a series of price lows or highs, used to measure the direction of the short-term trend.
Liquidation heat map: A visual breakdown of forced liquidations by exchange, often used to identify where leveraged traders are squeezed.
Position concentration: A measure of the distribution of token supply among a few wallets.
Methodology
The price levels cited in this article are directly derived from TradingView's chart analysis of the Binance SHIB/USDT trading pair over 1-day and 4-hour time frames. On-chain and clearing data comes from Coinglass and on-chain analysis dashboards. This does not constitute a financial recommendation.
Disclaimer : This article is for information purposes only and does not constitute any financial, investment or trading advice. Cryptocurrency markets, including Shiba Inu, are extremely volatile and may lead to significant losses. Always conduct independent research and consult a licensed financial adviser before making an investment decision.






















